Tsakos Energy Navigation Limited
$47.90 −0.70% from the 52-week high of $48.24
This analysis is based on closing-price data as of September 11, 2026. Whether you're researching how to buy Tsakos Energy Navigation Limited stock or you've just opened a brokerage account and are trying to time an entry, here are objective support levels and stop-loss references built from the RSI, MACD and ATR indicators.
TEN closed the week at $47.90, within 0.70% of its 52-week high and 133.7% above the 52-week low of $20.50 — a stock at the top of its two-year range rather than in the middle of it. The trend behind that position is not new: the close has held above both the 20-day and 60-day moving averages since August 27, MACD has been above its signal line since the August 13 golden cross, and the moving averages have been in bullish order for roughly a month. What is new is the final session: price jumped to a new swing high on volume 3.40× the 20-day average, closing above the upper Bollinger band with RSI at 77.86. That combination — a mature uptrend plus a vertical last bar — is the whole story here, and the two halves point in different directions on timing.
Snapshot all figures as of the September 11, 2026 close
| Metric | Value | Read |
|---|---|---|
| Close | $47.90 | New swing high; fibonacci anchor high dated Sep 11, 2026 |
| 52-week high / low | $48.24 / $20.50 | −0.70% from high · +133.7% from low |
| SMA 5 / 20 / 60 | $44.84 / $42.95 / $40.14 | Bullish order: close > 5 > 20 > 60 |
| Bollinger upper / mid / lower | $45.99 / $42.95 / $39.90 | Close is above the upper band; width 14.18% |
| aVWAP — 90d (anchor Jun 23, 2026) | $40.77 | Price well above short-term anchored VWAP |
| aVWAP — 2y (anchor Apr 4, 2025) | $28.77 | Long-term buyers are deep in profit |
| RSI(14) | 77.86 | Overbought zone (>70) |
| Mansfield RS vs the S&P 500 | +36.40% | Outperform, rising (prev week 23.11 · prev month 18.78) |
| MACD / signal / histogram | 1.390 / 1.032 / +0.358 | Golden cross Aug 13, 2026; histogram positive |
| ADX(14) | 22.40 | Emerging trend (20–25), not yet strong |
| ATR(14) | $1.48 (3.10% of price) | Daily range budget for position sizing |
| OBV — 2y / 90d | Early accumulation, above MA20, flat / Accumulation, above MA20, rising | Short-term buying pressure leads the long-term picture |
| Volume (last / 20-day avg) | 1,060,400 / 312,010 | 3.40× average — the single heaviest session of the 90-day window |
| 1× / 2× ATR stop | $46.42 / $44.93 | 2× ATR sits 6.20% below the close |
① Price & Moving Averages
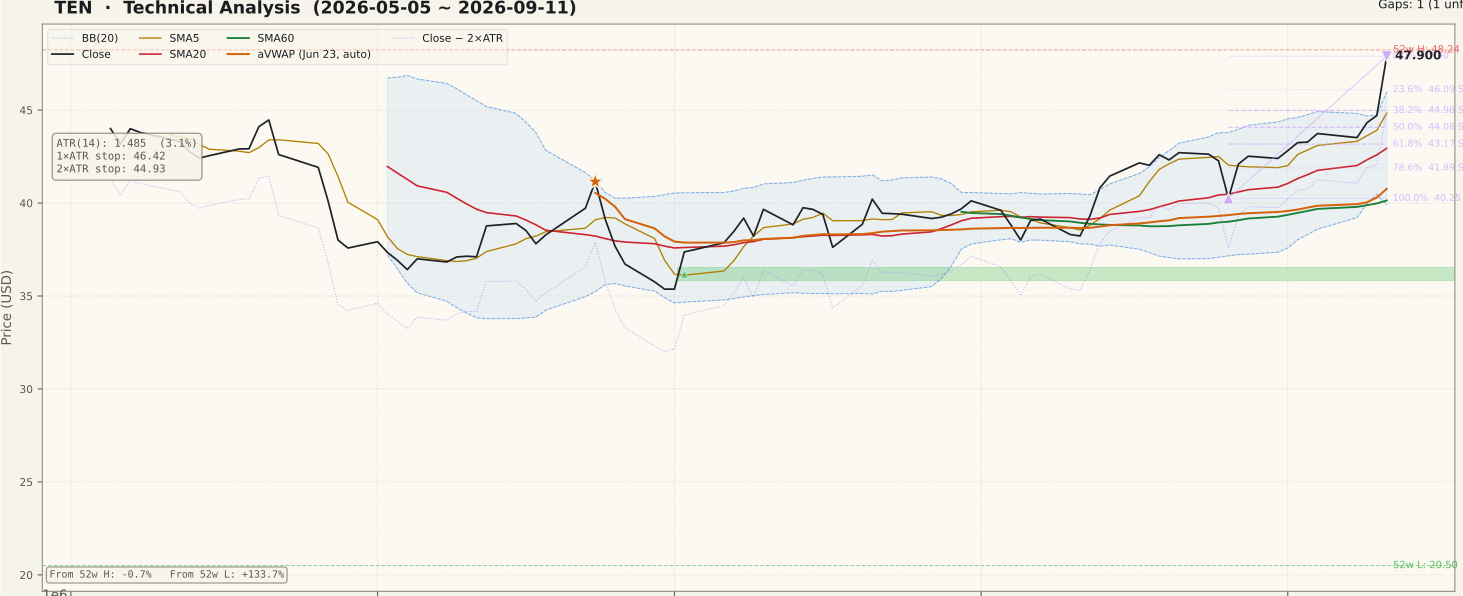
The moving averages are stacked in the textbook bullish order: close $47.90 > SMA5 $44.84 > SMA20 $42.95 > SMA60 $40.14. On the 90-day panel the shape is a long, flat base through May, June and July around the high-$30s, a first lift in late August, and then an almost vertical final bar. The 2-year context matters here — price is 133.7% above the $20.50 52-week low, so this is the upper end of a large advance, not a recovery off a bottom.
Two things about that last bar deserve honest weight. It carried price above the upper Bollinger band at $45.99, and the gap between the close and SMA5 ($44.84) is now more than two ATRs wide. Extension of that kind resolves in one of two ways: the band walks higher with the trend, or price mean-reverts toward the band and the moving averages catch up. The band width of 14.18% is not a squeeze reading, so the expansion is already underway rather than pending. The single unfilled gap in the record sits far below at $35.82–$36.54 (July 2, 2026) — a distant support reference, not an active magnet.
② Volume

The final session traded 1,060,400 shares against a 20-day average of 312,010 — a ratio of 3.40×, and visibly the tallest bar of the 90-day window. For a breakout, heavy volume is the confirmation you want: an advance to a new swing high on below-average volume is the classic false-breakout signature, and this is the opposite of that.
The caution is scale, not direction. A 312,010-share average is a modest base, so one 1.06-million-share session both confirms the move and distorts the average it is measured against — the next few sessions will reset the denominator. What the data does not tell us is why the volume arrived; no company-specific catalyst is identifiable from the chart record, and this page will not guess at one. Note also that the day before was already above average, so the surge built over two sessions rather than appearing from nowhere.
③ MACD

MACD reads 1.390 against a signal line of 1.032, a positive histogram of +0.358, and the last crossover was a golden cross on August 13, 2026 — roughly a month before the base date. That timing is the single most useful fact on this page: the momentum turn preceded the breakout session by weeks, so the trend is not an artifact of one bar.
Both lines are well above zero, which reads as a mature rather than an early-stage signal. A crossover far above zero has less room to run than one made from deep negative territory, and the histogram is the thing to watch: continued expansion confirms, while a shrinking histogram against a rising price would be the first quiet warning of momentum fading beneath the surface.
④ RSI

RSI(14) is 77.86, clearly inside the overbought zone above 70, and the 90-day panel shows it pushed through that line on the final bar after spending most of August in the 50s and 60s. The common beginner error here is treating >70 as a sell signal. In a genuine trend RSI can sit above 70 for extended stretches; overbought describes speed, not direction.
The honest framing is that the reading raises the cost of a late entry rather than predicting a reversal. The JSON reports no RSI divergence (the rsi.divergence field is null, with no peak pair recorded), so there is no evidence of price making highs that momentum refuses to confirm. Absence of divergence is a point for the bulls; it is not a guarantee, and it can appear later if a second high arrives on weaker momentum.
⑤ Mansfield Relative Strength

Mansfield RS vs the S&P 500 stands at +36.40%, in outperform territory with a rising slope. Reading the change rather than the level: one week ago the value was 23.11 and one month ago 18.78, so RS has gained 13.29 points over the week and 17.62 points over the month. Positive and rising means this is the accelerating quadrant — the strongest of the four states.
RS has been above zero across the entire 90-day panel, so the stock has been beating the index throughout the base as well as during the breakout. That distinguishes this setup from one where relative strength only arrives with the price spike. The caveat is that a large share of the weekly gain came from the final session, so the acceleration reading is itself partly a one-bar effect and should be re-read after a full week.
⑥ ATR & ADX

ATR(14) is $1.48, or 3.10% of price, and the panel shows it turning sharply higher on the last bar after drifting down through late August — volatility expanding with the move, as it usually does at a breakout. For sizing, that means a 2× ATR reference sits $2.97 below the close, at $44.93, which is 6.20% of position value.
ADX(14) is 22.40, labelled an emerging trend. That is the most under-appreciated number on the page: it sits in the 20–25 band, below the 25 threshold that marks a strong trend, and it has only just started rising off the bottom of its 90-day range. A price at a 52-week high with ADX still under 25 says the directional conviction is younger than the price action suggests. ADX measures strength, not direction, so a rise from here would confirm whichever way price resolves.
⑦ OBV

The two timeframes disagree in a useful way. On the 90-day window OBV is tagged accumulation, above its MA20 and rising, with the OBV-versus-MA20 spread at 192.24%. On the 2-year window it is early accumulation, above MA20 but with a flat slope and a spread of 51.61%. Short-term buying pressure is running well ahead of the long-term accumulation picture, which is what a fresh breakout out of a long base should look like.
Two clarifications. The 192.24% figure is the spread between OBV and its own 20-day average — a measure of how far short-term flow has stretched from its baseline, not a divergence reading, and it inflates when the moving average sits near zero, which is the case here (90-day OBV MA20 is negative at −1,215,980). Separately, the JSON records no OBV divergence (the obv.divergence field is null, no peak pair). So the flow data confirms the price move without flagging the "new high, lagging volume" warning pattern.
Bull vs Bear
Bull Case
- Moving averages in full bullish order — close $47.90 > SMA5 $44.84 > SMA20 $42.95 > SMA60 $40.14.
- MACD golden cross on August 13, weeks before the breakout bar, with the histogram still positive at +0.358 — the trend predates the spike.
- Mansfield RS +36.40% and accelerating: +13.29 points on the week, +17.62 on the month, versus the S&P 500.
- Volume confirmation is unambiguous — 3.40× the 20-day average on the breakout session, the heaviest bar of the 90-day window.
- OBV in accumulation on the 90-day view, above MA20 and rising, with no bearish divergence recorded on either OBV or RSI.
- Price is far above both anchored VWAPs ($40.77 short-term, $28.77 long-term), so there is little trapped supply directly overhead.
Bear Case
- RSI 77.86 is deep in overbought territory, reached in a single session rather than through a gradual climb.
- The close is above the upper Bollinger band at $45.99 — a statistically stretched position that historically resolves with either a pause or a snap-back.
- Price sits just 0.70% below the 52-week high of $48.24, the most obvious supply zone on the chart.
- ADX 22.40 is still below the 25 strong-trend threshold, so directional conviction has not yet been confirmed by the trend-strength gauge.
- The gap between the close and SMA5 exceeds two ATRs; any entry at these levels starts with the stop unusually far away in percentage terms (6.20%).
- No company-specific catalyst is identifiable behind the volume surge, and the 20-day average volume base of 312,010 shares is thin enough that one large session can dominate the tape.
Scenarios
| Scenario | Probability | Path | Trigger / Invalidation |
|---|---|---|---|
| Breakout continuation | 40% | Price clears the 52-week high at $48.24 and walks the upper Bollinger band while SMA5 rises to meet it; ADX pushes through 25. | Trigger: a close above $48.24 on volume at or above average. Invalidation: a close back below $46.09 (23.6% retracement). |
| Digest and rebuild | 40% | The extension unwinds sideways or with a shallow pullback into the $44.98–$46.09 retracement band while SMA20 climbs; RSI cools out of overbought without the trend breaking. | Trigger: two or three narrow-range sessions on fading volume. Invalidation: a close below the 61.8% retracement at $43.17. |
| Failed breakout | 20% | The high-volume bar marks exhaustion rather than initiation; price reverses back inside the Bollinger band and gives up the late-August advance toward SMA20 and the swing low at $40.25. | Trigger: a close below the 2× ATR reference at $44.93 on rising volume. Invalidation of this bearish path: reclaiming $47.90. |
Probabilities are subjective estimates derived from the chart structure, not statistical forecasts.
Key Levels
| Price | Role | Basis |
|---|---|---|
| $48.24 | Resistance | 52-week high — the last overhead reference on the chart |
| $47.90 | Current close | Sep 11, 2026 close; 0% anchor of the current up-swing (fibonacci anchor high) |
| $46.09 | Support | 23.6% retracement of the $40.25 → $47.90 swing |
| $45.99 | Support | Upper Bollinger band — the level price must hold to keep "band walking" intact |
| $44.98 | Support | 38.2% retracement — first structurally meaningful pullback level |
| $44.93 | 2× ATR stop | Objective invalidation — 6.20% below the close |
| $42.95 | Support | SMA20 and Bollinger midline — the trend's short-term backbone |
What to Watch
- Volume on the follow-through. If the sessions after a 3.40× bar shrink back below average while price holds, the breakout is being absorbed. If price fades and volume stays heavy, distribution is the more likely read.
- Whether $48.24 is cleared or rejected. Sitting 0.70% under a 52-week high is the definition of an untested edge; the reaction there settles the "continuation versus exhaustion" question faster than any indicator.
- ADX crossing 25. The trend-strength gauge has not yet confirmed what price is doing. A push above 25 would validate the move; a stall in the low 20s leaves the breakout unsupported.
- The MACD histogram. Continued expansion above +0.358 confirms; contraction while price holds up is the earliest warning that momentum is draining.
- A catalyst check. The chart shows a large advance on heavy volume, but nothing in the price record identifies the reason. Verify the news and filing record before treating the technical picture as complete.
Conclusion
Past Analyses of This Stock same ticker · newest first
Other signals from this issue same publication date · 5 stocks
This analysis is an educational interpretation of chart data and is not investment advice. Probabilities and levels are subjective estimates; every investment decision, and its outcome, is your own responsibility. A bottoming signal is not a buy signal, and a breakout is not a guarantee of continuation.
Two Week Swing · twoweekswing.com · 4,600+ stocks screened weekly