Arcturus Therapeutics Holdings Inc.
$14.73 −39.1% from the 52-week high of $24.17 · +167.8% from the 52-week low of $5.50
This analysis is based on closing-price data as of September 11, 2026. Whether you're researching how to buy Arcturus Therapeutics Holdings Inc. stock or you've just opened a brokerage account and are trying to time an entry, here are objective support levels and stop-loss references built from the RSI, MACD and ATR indicators.
Two years of data show a stock that spent most of that stretch below its benchmark and bottomed at $5.50 before a violent July–August advance carried it to $16.17 on August 27. The longer-term frame is still constructive: the close of $14.73 sits above SMA20 ($13.72), SMA60 ($9.01), the 90-day anchored VWAP ($13.71) and the two-year anchored VWAP ($9.07), and Mansfield RS reads +42.0% against the Nasdaq Composite. The near-term tape, however, has gone the other way — MACD dead-crossed on September 9, the close is back below SMA5 ($14.98), and the last six sessions contain two declines of more than 5%. Those two facts sit in tension, and this page treats them as such rather than resolving them in either direction.
Snapshot all figures from the chart JSON · as of September 11, 2026
| Close | $14.73 |
|---|---|
| 52-week high / low | $24.17 (−39.1%) / $5.50 (+167.8%) |
| SMA5 / SMA20 / SMA60 | $14.98 / $13.72 / $9.01 — close below SMA5, above SMA20 and SMA60 |
| Bollinger (20) | Upper $19.47 · Mid $13.72 · Lower $7.97 · width 83.8% |
| aVWAP — 90d | $13.71 (anchor Aug 19, 2026) — price above |
| aVWAP — 2y | $9.07 (anchor Oct 22, 2025) — price above |
| RSI (14) | 62.1 — no RSI divergence flagged |
| Mansfield RS | +42.0% vs the Nasdaq Composite · outperform · prior week 46.79 · prior month −29.83 |
| MACD (12,26,9) | MACD 1.799 · Signal 2.064 · Histogram −0.265 · dead cross Sep 9, 2026 |
| ADX (14) | 53.4 — strong trend (direction-neutral) |
| ATR (14) | $1.27 — 8.6% of price |
| OBV — 2y / 90d | Accumulation, above MA20, rising in both frames · spread vs own MA20: 114.19% (2y) / 26.78% (90d) · bullish divergence flagged in both |
| Volume | 496,600 shares — 0.32× the 20-day average of 1,549,735 |
| Stop references | 1×ATR $13.46 (−8.6%) · 2×ATR $12.20 (−17.2%) |
① Price & Moving Averages
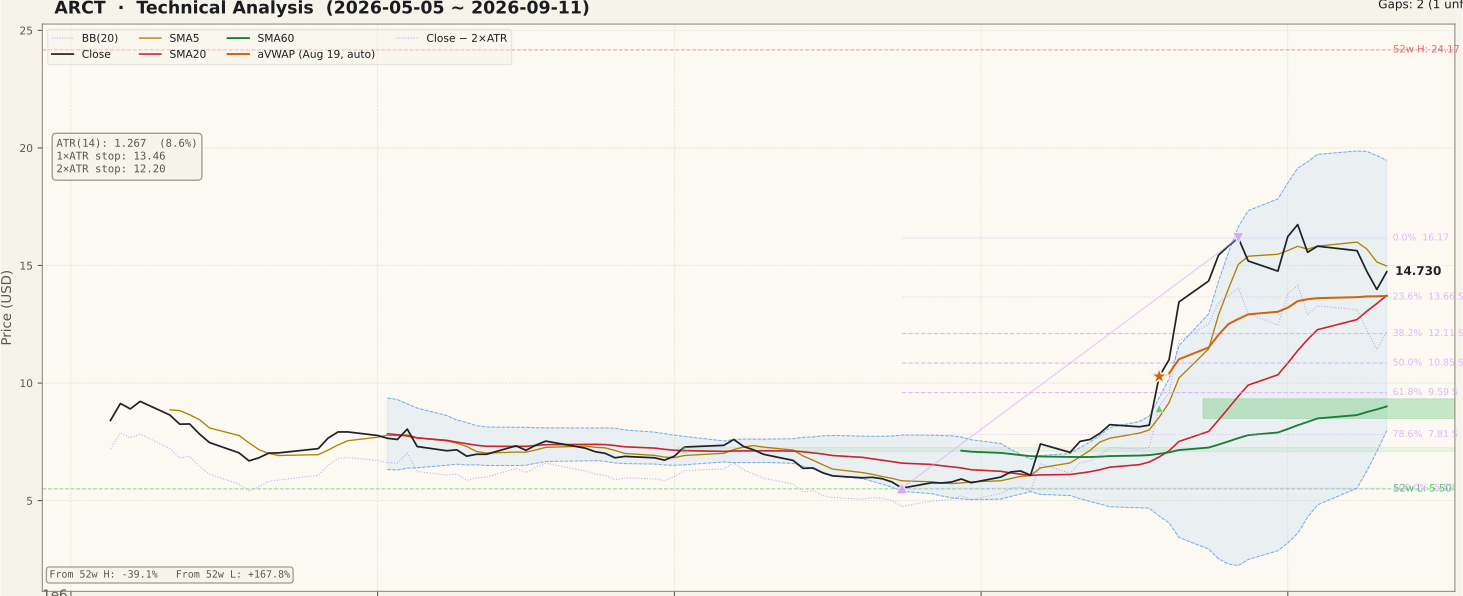
The moving-average stack is bullish but incomplete. SMA5 $14.98 > SMA20 $13.72 > SMA60 $9.01 has held for 16 sessions since August 20, and the close has stayed above SMA20 and SMA60 for 25 sessions since August 7. What is missing is the top rung: at $14.73 the close is below SMA5, so the textbook Close > SMA5 > SMA20 > SMA60 alignment is not currently intact and the five-day line is acting as near-term resistance rather than support.
Bollinger width of 83.8% quantifies how far the bands were forced apart by the July–August advance; a reading that wide is a record of past expansion, not a forecast, and mid-band $13.72 doubles as the SMA20 line just below price. Fibonacci is anchored on the up-swing from $5.53 (July 24) to $16.17 (August 27): the 23.6% retracement sits at $13.66 and the 38.2% at $12.11, so the current pullback has not yet consumed even the shallowest of those levels. Overhead, the 90-day frame leaves one unfilled gap at $8.49–$9.33 (August 19) as distant support, while the two-year frame carries an unfilled gap dated October 22, 2025 spanning $11.69–$20.80 — price now trades inside that band, so its unfilled portion above the close runs to $20.80.
② Volume

The final session traded 496,600 shares, just 0.32× the 20-day average of 1,549,735. That number cuts both ways and the honest reading keeps both edges. On one hand, the September decline happened on unremarkable turnover — the sessions that produced it ran between roughly a third and two-thirds of average volume, which is drift rather than distribution at scale. On the other hand, the +5.36% rebound into the base date came on the lightest volume of the stretch, and a bounce that thin is not confirmation of anything.
The chart's own volume panel shows where the real participation sat: the heavy bars cluster in the late-August advance, not in the September give-back. For a stock whose average turnover is around 1.5 million shares a day, liquidity is adequate, but position sizing should still respect an ATR that is 8.6% of price.
③ MACD

This is the clearest bearish item on the page. MACD at 1.799 has crossed below its signal line at 2.064, the histogram has turned negative at −0.265, and the JSON dates that dead cross to September 9, 2026 — meaning zero consecutive sessions above the signal line as of the base date.
Context matters in both directions. The cross occurred far above the zero line, which is the signature of momentum cooling inside an established uptrend rather than a trend reversal being confirmed; a dead cross below zero would be a materially more negative reading. Equally, the histogram is the fastest-moving element here and it has already flipped, so the burden of proof now sits with the buyers. A histogram that shrinks back toward zero and turns positive would be the first mechanical sign the September cooling is finished.
④ RSI

RSI(14) reads 62.1 — above the 50 midline, below the 70 overbought threshold. The shape on the panel is a descent out of the overbought zone the stock occupied through late August, which is what a normal cooling phase looks like: the oscillator gives back the excess without breaking the midline.
No RSI divergence is flagged in the JSON, and both peak fields are null, so no peak-to-peak comparison is claimed here. The level to respect is 50: an RSI that holds above it while price consolidates keeps the uptrend reading defensible, whereas a decisive break below 50 would align the oscillator with the MACD cross and remove one of the remaining supports for the constructive case.
⑤ Mansfield Relative Strength

Mansfield RS is +42.0% versus the Nasdaq Composite — firmly above the zero line, state "outperform". This is the single strongest number on the page and it is what put the stock into this week's screen. The anchor-free construction means the 2-year and 90-day panels agree, and they do.
The two quadrant calculations disagree with each other, which is worth stating plainly. Against the prior week's 46.79 the weekly change is −4.80 points: positive territory, decelerating. Against the prior month's −29.83 the monthly change is +71.83 points: positive territory, accelerating. In other words, the stock crossed from deep underperformance to strong outperformance over the month and has given a little of that edge back over the week. The JSON's slope field reads "rising", which describes the longer arc rather than the last five sessions — the weekly figure is the one that matches the recent tape.
⑥ ATR & ADX

ATR(14) is $1.27, or 8.6% of the closing price. That is a large volatility unit and it drives everything on the risk side of this page: a 2×ATR stop lands at $12.20, which is $2.53 or 17.2% below the close. Anyone sizing a position off a tighter stop is choosing to be shaken out by ordinary daily range rather than by a change in the chart.
ADX(14) at 53.4 confirms a strong trend, and the panel shows it climbing steeply through August. The standard warning applies with unusual force this week: ADX measures trend strength, not direction. A high ADX is equally consistent with a powerful advance and with a sharp decline, so it corroborates that the July–August move was a genuine trend rather than noise, but it says nothing about which way the next leg runs.
⑦ OBV

Both timeframes tag OBV as accumulation, above its MA20 and rising. The 90-day OBV of 18,288,400 sits 26.78% above its own MA20 of 14,425,575; the 2-year series reads 479,900 against an MA20 of −3,382,925, a 114.19% spread. Note that this spread is the OBV-versus-MA20 gap — a measure of accumulation intensity — and not a divergence reading; the two-year figure in particular is inflated because its MA20 is close to zero.
The divergence field itself is the more interesting item, and it is the main counterweight to the MACD cross. Both frames flag a bullish divergence off the same two peaks: price fell from $14.76 on August 31 to $13.98 on September 10, while 90-day OBV rose from 14,337,500 to 17,791,800 over the same span (2-year OBV: −3,471,000 to −16,700). Price made the lower low; the volume series did not follow. That is the classic non-confirmation of a decline — but a divergence is a possibility of reversal, not a confirmed low, and it means nothing until price itself reclaims a level.
Bull Case vs Bear Case
Bull Case
- Mansfield RS +42.0% versus the Nasdaq Composite, state "outperform" — a genuine market leader on the relative-strength axis.
- SMA5 $14.98 > SMA20 $13.72 > SMA60 $9.01 has held 16 sessions since August 20; the close has been above SMA20 and SMA60 for 25 sessions since August 7.
- OBV is in accumulation, above MA20 and rising in both timeframes — the September decline did not break the volume trend.
- Bullish OBV divergence in both frames: price $14.76 (Aug 31) → $13.98 (Sep 10) while 90-day OBV rose 14,337,500 → 17,791,800.
- Price holds above both anchored VWAPs — 90-day $13.71 (Aug 19 anchor) and 2-year $9.07 (Oct 22, 2025 anchor) — so buyers from both anchors remain in profit.
- The pullback is shallow in Fibonacci terms: at $14.73 the close is still above the 23.6% retracement of $13.66 on the $5.53 → $16.17 advance.
Bear Case
- MACD dead-crossed on September 9 — MACD 1.799 below signal 2.064, histogram −0.265, zero sessions above the signal line.
- The close of $14.73 is below SMA5 $14.98, so the full Close > SMA5 > SMA20 > SMA60 stack is broken at the top.
- The recent tape is negative: −5.69% on September 9 and −5.16% on September 10, roughly −12% across September 8–10 before a partial rebound.
- Relative strength is decelerating week over week — 41.99 versus the prior week's 46.79 is a −4.80 point give-back inside positive territory.
- ATR is 8.6% of price, so an objective 2×ATR stop sits $2.53 (−17.2%) below the close — a wide risk unit that forces small position sizing.
- The stock is still −39.1% below its 52-week high of $24.17, and the unfilled October 22, 2025 gap caps overhead all the way to $20.80.
Scenarios
| Scenario | Probability | Path | Trigger / Invalidation |
|---|---|---|---|
| Higher-low continuation | 40% | The September give-back proves to be a pullback inside the trend: price reclaims SMA5 $14.98, works back toward the August 27 swing high of $16.17, and the MACD histogram turns positive again. | Trigger: close above $14.98 on volume above the 20-day average of 1,549,735 shares. Invalidation: close below the $13.66–$13.72 cluster. |
| Range digestion | 35% | Price oscillates between the $13.66–$13.72 support cluster and the $16.17 high while the MACD cross is worked off and Bollinger width contracts from 83.8%. | Trigger: repeated closes trapped between SMA20 and SMA5 with RSI holding 50–65. Invalidation: a decisive close outside either edge of that range. |
| Deeper retracement | 25% | The SMA20 / aVWAP / 23.6%-Fib cluster gives way and the move extends toward the 38.2% retracement at $12.11, taking out the objective stop reference on the way. | Trigger: close below $13.66 with RSI losing 50. Invalidation: a fast reclaim of $13.72 and the anchored VWAP. |
Probabilities are subjective estimates derived from the chart structure described above, not statistical forecasts.
Key Levels
| Price | Role | Basis |
|---|---|---|
| $16.17 | Resistance | Swing high of August 27, 2026 · 0% of the Fibonacci swing |
| $14.98 | Resistance | SMA5 — the line price closed back under |
| $14.73 | Current close | Close of September 11, 2026 |
| $13.72 | Support | SMA20 and Bollinger mid-band |
| $13.71 | Support | 90-day anchored VWAP (anchor August 19, 2026) |
| $13.66 | Support | 23.6% retracement of the $5.53 → $16.17 up-swing |
| $12.20 | 2×ATR stop | Objective invalidation, −17.2% from the close (ATR $1.27) |
What to Watch
- SMA5 at $14.98. Reclaiming it restores the complete moving-average stack; continued closes below it keep the five-day line as resistance.
- The MACD histogram. It turned negative at −0.265 on the September 9 cross — a return toward zero and back above it is the first mechanical sign the cooling has run its course.
- The $13.66–$13.72 cluster. SMA20, the 90-day anchored VWAP and the 23.6% retracement all land within six cents of each other; that is where the constructive reading is tested.
- Volume on any recovery. The +5.36% rebound into the base date came on 0.32× average volume. A move back toward $16.17 on sub-average turnover is the classic unconfirmed breakout.
- Weekly relative strength. RS has slipped from 46.79 to 41.99. Stabilising above 40 keeps the leadership case; a continued slide would erode the one metric that is unambiguously strong.
Conclusion
Past Analyses of This Stock same ticker · newest first
Other signals from this issue same publication date · 5 stocks
This analysis is an educational interpretation of chart data and is not investment advice. Probabilities and levels are subjective estimates; every investment decision, and its outcome, is your own responsibility. All figures are derived from closing-price data through September 11, 2026 and are not updated after publication.
Two Week Swing · twoweekswing.com · 4,600+ stocks screened weekly