TORM plc
$35.08 −2.4% from the 52-week high of $35.94
This analysis is based on closing-price data as of September 11, 2026. Whether you're researching how to buy TORM plc stock or you've just opened a brokerage account and are trying to time an entry, here are objective support levels and stop-loss references built from the RSI, MACD and ATR indicators.
Over the two-year window TRMD traced a full cycle: a slide from the September 2024 highs into an April 2025 trough near the 52-week low of $19.30, a long basing phase through 2025, and a trend that has been rebuilding since January 2026. The stock now closes at $35.08 — just 2.4% under the 52-week high of $35.94 and 81.8% above the low — with every moving average stacked in ascending order and Mansfield RS at +22.20% against the Nasdaq Composite. The short-term picture is narrower: after a late-August breakout out of a two-month base, price has come back to sit almost exactly on its 5-day average, which is what a shallow pullback inside an intact advance looks like. The question this chart poses is whether the dense supply band overhead — the 52-week high and an unfilled September 2024 gap — absorbs the move or lets it through.
Snapshot all figures as of the September 11, 2026 close
| Metric | Value | Read |
|---|---|---|
| Close (Sep 11, 2026) | $35.08 | Upper end of the 2-year range |
| 52-week high / low | $35.94 / $19.30 | −2.4% from high · +81.8% from low |
| SMA5 / SMA20 / SMA60 | $35.05 / $32.58 / $30.17 | Close > 5 > 20 > 60 — bullish alignment |
| Bollinger (20) upper / mid / lower | $36.31 / $32.58 / $28.86 | Width 22.86% — expanded after a squeeze |
| aVWAP — 90d (anchor Jun 23, 2026) | $30.44 | Price 15.2% above the short-horizon anchor |
| aVWAP — 2y (anchor Mar 5, 2026) | $29.91 | Price 17.3% above the long-horizon anchor |
| RSI(14) | 67.95 | Elevated, still below 70 · no divergence flagged |
| Mansfield RS vs Nasdaq Composite | +22.20% | Outperform, rising (prev week 18.54 · prev month 2.35) |
| MACD(12,26,9) | 1.383 / signal 1.138 / hist +0.245 | Golden cross Aug 17, 2026 — still widening |
| ADX(14) | 22.37 | Emerging — not yet a confirmed trend (>25) |
| ATR(14) | $1.08 (3.07% of price) | One average session ≈ 3% of the price |
| OBV — 90d / 2y | −2,877,100 / −43,981,400 | 90d accumulation (above MA20, rising) · 2y early accumulation (above MA20, flat) |
| Volume (Sep 11) | 1,359,000 vs 20-day avg 923,730 | 1.47× average — participation present |
| 1× / 2× ATR stop | $34.00 / $32.93 | −3.07% / −6.14% from the close |
① Price & Moving Averages
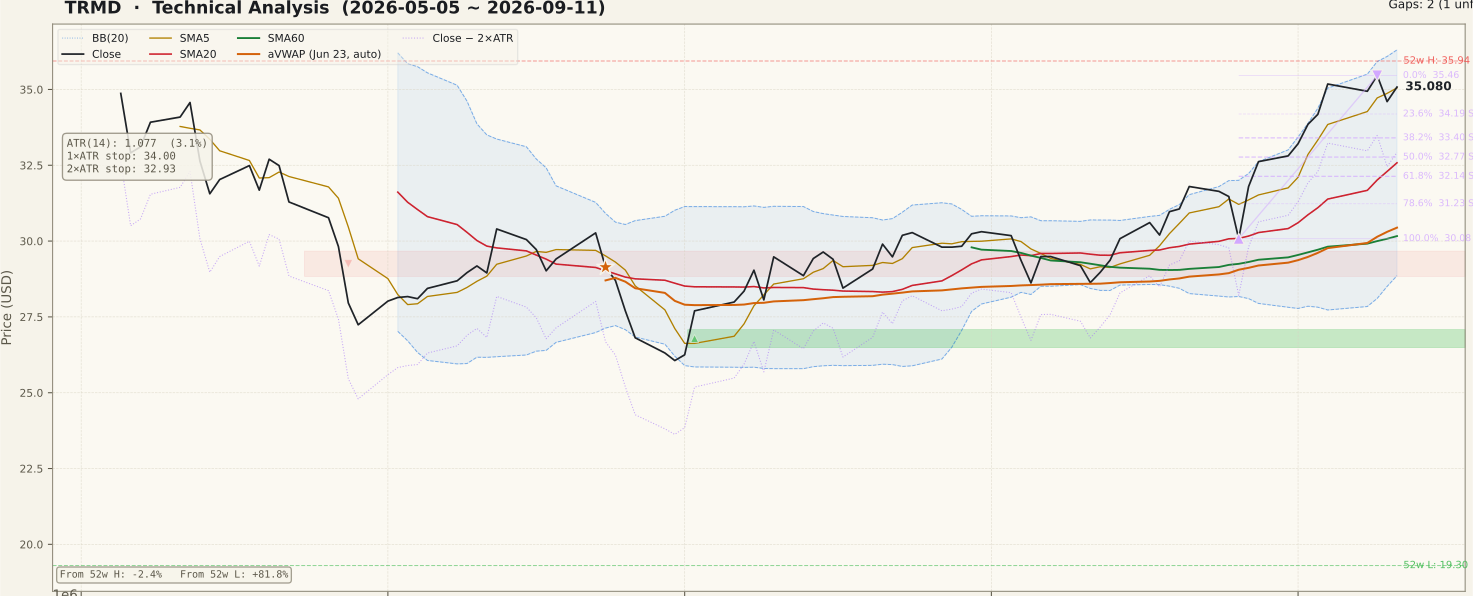
The moving-average stack is textbook ascending: close $35.08 above SMA5 $35.05, which sits above SMA20 $32.58 and SMA60 $30.17, with all three sloping up. The last bar is effectively sitting on the 5-day line rather than extended above it — the close is only a fraction of a percent clear of SMA5 — so the most recent session is a pullback inside the advance, not a fresh thrust. Price is 7.7% above SMA20, which is stretched but not extreme relative to an ATR of $1.08.
Bollinger Bands have expanded to a 22.86% width after the July–August contraction, with the upper band at $36.31 and the lower at $28.86. The 90-day anchored VWAP from June 23 sits at $30.44 and the two-year anchor from March 5 at $29.91; price is 15.2% and 17.3% above them respectively, so buyers from both horizons are holding gains and the overhead supply from those cohorts is thin. The Fibonacci frame is an up-swing anchored on the August 26 low of $30.08 and the September 9 high of $35.46, putting retracement support at $34.19 (23.6%), $33.40 (38.2%) and $32.77 (50%). Above price, the two-year chart still shows an unfilled resistance gap between $35.27 and $36.23 dated September 20, 2024 — the 52-week high of $35.94 sits inside it, making that band the single most important obstacle on the page.
② Volume

The September 11 session traded 1,359,000 shares against a 20-day average of 923,730 — a ratio of 1.47×. That matters more than it usually would, because the pullback-to-SMA5 shape can mean two very different things depending on who is transacting. Volume above average on a session that finishes near the highs of the recent range is participation, not liquidation.
The 90-day panel shows the pattern beginners most often misread: the largest single bar in the window came near the late-June low, not at the September high. Capitulation volume marks the end of a decline; the advance since then has been built on comparatively ordinary turnover with the 20-day average grinding higher rather than spiking. A breakout attempt through $35.46 and $35.94 that arrives on volume below the 923,730 average would be the classic unconfirmed breakout and should be treated as such.
③ MACD

MACD reads 1.383 against a signal line of 1.138, with the histogram positive at +0.245. The controlling event is the golden cross dated August 17, 2026, which is now roughly four weeks old and has held without a reversal. Both lines are well above the zero line, so this is a momentum reading taken inside an established up-leg rather than the early, low-conviction cross that occurs deep in negative territory.
The honest caveat is that a MACD this far above zero is a mature reading, not an early one. The histogram is the thing to track: it is still positive, but a sequence of shrinking bars while price holds near $35 would mark momentum rolling over before the price does. On the two-year panel the same crossover pattern has repeated many times in both directions, which is a useful reminder that a cross is a change in momentum, not a forecast of magnitude.
④ RSI

RSI(14) is 67.95 — elevated, just under the conventional 70 line, and roughly at the top of the
range it has occupied for the past three months. The rsi.divergence field is
null, so no regular divergence is flagged in this dataset and no peak pair is
available; there is nothing here to call a top from.
Readings in the high 60s are ambiguous by design. In a genuine trend, RSI can walk along and above 70 for weeks — treating the first touch as an exit signal is one of the more expensive beginner habits. What separates the two cases is behaviour, not level: sustained readings above 70 while price makes higher lows is trend confirmation, while a single poke above 70 followed by a rollback under 60 is the more common failure signature. TRMD has not yet resolved which of those it is doing.
⑤ Mansfield Relative Strength

Mansfield RS stands at +22.20% against the Nasdaq Composite, tagged outperform with a rising slope. Because the measure is anchor-free, the 90-day and two-year panels agree exactly, which is what you want to see before leaning on it. Against the prior week's 18.54 the change is +3.66 points, and against the prior month's 2.346 it is +19.85 points. Positive territory with a positive change is the accelerating quadrant — the strongest of the four configurations.
The two-year panel adds the context that makes this reading meaningful: RS spent all of late 2024 and most of 2025 deep in negative territory, bottoming near −50, and only crossed above zero in January 2026. This is a genuine leadership change rather than a stock that has always outperformed. The counterweight is that relative strength measures the stock against an index, not against zero risk — a market-wide drawdown can leave RS positive while the position still loses money.
⑥ ATR & ADX

ATR(14) is $1.08, or 3.07% of the close. That is the sizing input that matters most on this page: the 1× ATR reference sits at $34.00 and the 2× ATR reference at $32.93, which is 6.14% below the current price. Anyone anchoring a stop tighter than roughly $34 is placing it inside a single average session's range, where ordinary noise will trigger it independently of whether the swing is intact.
ADX(14) reads 22.37 and is tagged emerging. It has turned up from the low-to-mid teens where it spent August, so trend strength is building, but it has not yet crossed the 25 threshold that would mark a confirmed trend. ADX is a strength measure with no directional content, so a rise from here simply means whichever direction wins gets more follow-through. The combination of rising ATR and a sub-25 ADX describes a market that has begun to move but has not yet proven it will keep moving.
⑦ On-Balance Volume

The two timeframes carry different tags and both are worth stating. On 90 days, OBV is −2,877,100 against a 20-day average of −5,888,275 — above its average and rising, tagged accumulation, with a reported OBV-versus-MA20 spread of 51.14%. On two years, OBV is −43,981,400 against an average of −46,992,575 — also above its average but with a flat slope, tagged early accumulation and a spread of 6.41%.
Read together, the near-term buying pressure is real but it is repairing a very deep hole. The
cumulative two-year OBV remains far below where it started, reflecting the heavy distribution of
the 2024–2025 decline, and the flat long-horizon slope says that damage has been arrested rather
than reversed. One clarification on the field itself: the spread figure is the distance between
OBV and its own 20-day average — a measure of near-term buying intensity — and is not a
divergence reading. The actual divergence field, obv.divergence, is
null here, so no OBV divergence is flagged and no peak pair is available.
Bull Case vs Bear Case
Bull Case
- Full ascending alignment — close $35.08 > SMA5 $35.05 > SMA20 $32.58 > SMA60 $30.17, all rising.
- Mansfield RS +22.20% vs the Nasdaq Composite, up 3.66 points on the week and 19.85 on the month — positive and accelerating.
- MACD 1.383 over signal 1.138 with a positive histogram (+0.245); the August 17 golden cross has held for four weeks.
- Volume of 1,359,000 on September 11 is 1.47× the 20-day average of 923,730 — the pullback session had real participation.
- 90-day OBV at −2,877,100 is above its MA20 of −5,888,275 and rising, tagged accumulation.
- Price sits 15.2% above the 90-day aVWAP ($30.44) and 17.3% above the two-year aVWAP ($29.91) — little trapped supply from recent buyers.
Bear Case
- RSI 67.95 leaves limited short-term headroom before the 70 line, and price is only 2.4% under the 52-week high.
- Dense overhead supply: the September 20, 2024 unfilled gap spans $35.27–$36.23 and contains the 52-week high of $35.94.
- ADX 22.37 is still tagged emerging — trend strength has not been confirmed above 25.
- Two-year OBV of −43,981,400 with a flat slope shows the 90-day improvement is coming off a deeply distributed base.
- Price is 7.7% above SMA20 with Bollinger width expanded to 22.86% after a squeeze — the mean-reversion pull is toward $34.19 and $33.40.
- ATR of $1.08 (3.07%) means an ordinary session can travel through the first retracement level; the 2× ATR stop is 6.14% away, a wide risk unit.
Scenarios
| Scenario | Probability | Path | Trigger / Invalidation |
|---|---|---|---|
| Breakout through the 2024 gap band | 45% | Holds the $34.19 (23.6%) shelf, reclaims the September 9 high of $35.46, then presses into the $35.27–$36.23 gap toward the Bollinger upper band at $36.31. | Trigger: daily close above $35.94 on volume at or above 923,730. Invalidation: close back under $33.40 (38.2%). |
| Range under the 52-week high | 35% | Rotation between roughly $33.40 and $35.46 while SMA20 at $32.58 catches up; ADX stalls under 25 and the histogram flattens. | Trigger: repeated rejections below $35.46 without losing $33.40. Invalidation: a decisive close either above $35.94 or below $32.93. |
| Failed breakout back into the base | 20% | Rejection at the gap band, loss of the 2× ATR reference at $32.93, then a retest of $32.14 (61.8%) and the August 26 swing low of $30.08. | Trigger: daily close below $32.93. Invalidation: recovery and close back above $34.19. |
Key Levels
| Price | Role | Basis |
|---|---|---|
| $36.31 | Resistance | Bollinger upper band (20) |
| $35.94 | Resistance | 52-week high — sits inside the unfilled Sep 20, 2024 gap ($35.27–$36.23) |
| $35.46 | Resistance | September 9, 2026 swing high · 0% of the Fibonacci up-swing |
| $35.08 | Current | September 11, 2026 close — resting on SMA5 ($35.05) |
| $34.19 | Support | 23.6% retracement of the $30.08 → $35.46 swing |
| $33.40 | Support | 38.2% retracement — first structural shelf |
| $32.93 | 2× ATR stop | Objective invalidation, −6.14% from the close; just above the 50% retracement ($32.77) and SMA20 ($32.58) |
What to Watch
- Volume on any push through $35.46 → $35.94. A move into the 2024 gap band on turnover below the 923,730 average is the textbook unconfirmed breakout.
- ADX crossing 25. From 22.37, a cross would upgrade the trend from emerging to confirmed; stalling back under 20 argues for the range scenario instead.
- RSI behaviour at 70. Band-walking above 70 while price makes higher lows is confirmation; a single poke followed by a slide under 60 is the more common failure signature.
- OBV holding above its 20-day average (−5,888,275). Losing that line would mean the accumulation tag turned over ahead of price.
- The $34.19 / $33.40 retracement shelf. Holding there on a pullback keeps the August 26 swing structure intact; closing beneath it does not.
Conclusion
Past Analyses of This Stock same ticker · newest first
Other signals from this issue same publication date · 5 stocks
This analysis is an educational interpretation of chart data and is not investment advice. Probabilities and levels are subjective estimates; every investment decision, and its outcome, is your own responsibility. Technical signals describe what price and volume have already done — they do not account for earnings, guidance, regulatory events or other fundamental developments.
Two Week Swing · twoweekswing.com · 4,600+ stocks screened weekly