Himalaya Shipping Ltd.
$18.09 −4.08% from the 52-week high ($18.86)
This analysis is based on closing-price data as of September 11, 2026. Whether you're researching how to buy Himalaya Shipping Ltd. stock or you've just opened a brokerage account and are trying to time an entry, here are objective support levels and stop-loss references built from the RSI, MACD and ATR indicators.
Over two years this chart has gone from a $7.37 low to $18.09, a gain of 145.45%, and the advance has been built in steps rather than in one move: a long base, a February 2026 acceleration, a multi-month digestion through the summer, and a fresh push in August and September that leaves price 4.08% under the $18.86 52-week high. The short-term picture is a shallow pause inside that push — the close sits 0.15% below SMA5 $18.12 while still holding 6.70% above SMA20 $16.95 and 15.85% above SMA60 $15.62. Relative strength is the strongest part of the case and trend strength is the weakest: Mansfield RS is +37.60% against the S&P 500 and rising, while ADX at 20.19 is still only "emerging". Read this page as a study of whether a stock this close to its high is being accumulated or distributed — not as a call on the outcome.
Snapshot all figures as of the September 11, 2026 close
| Metric | Value | Reading |
|---|---|---|
| Close | $18.09 | Sep 11, 2026 close |
| 52-week high / low | $18.86 / $7.37 | −4.08% from the high, +145.45% off the low |
| SMA5 / SMA20 / SMA60 | $18.12 / $16.95 / $15.62 | Bullish order; close is 0.15% under SMA5, +6.70% over SMA20, +15.85% over SMA60 |
| Bollinger (20) | Upper $18.69 · Mid $16.95 · Lower $15.22 | Band width 20.43%; upper band 3.29% above the close |
| aVWAP — 90-day | $15.78 | Anchored June 26, 2026; price +14.65% above it |
| aVWAP — 2-year | $10.86 | Anchored December 2, 2024; price +66.61% above it |
| RSI(14) | 66.04 | Below the 70 overbought line; no RSI divergence flagged |
| Mansfield RS vs the S&P 500 | +37.60% | Outperform, rising · prior week 36.55, prior month 22.00 |
| MACD (12,26,9) | 0.6698 / signal 0.5652 / hist +0.1046 | Golden cross August 17, 2026; both lines above zero |
| ADX(14) | 20.19 | Emerging — below the 25 strong-trend threshold |
| ATR(14) | 0.5867 | 3.243% of price — one average session covers 3.2% |
| OBV — 2-year | 8,666,400 vs MA20 7,681,395 | Accumulation, above its MA20 by 12.82%, rising |
| OBV — 90-day | 1,030,100 vs MA20 45,095 | Accumulation, rising; the +2,184.29% MA20 spread is distorted by a near-zero MA20 (see section ⑦) |
| Volume | 636,800 vs 20-day avg 368,340 | 1.73× the 20-day average on the last session |
| Stop references | 1×ATR $17.50 · 2×ATR $16.92 | 2×ATR sits 6.48% below the close |
① Price & Moving Averages
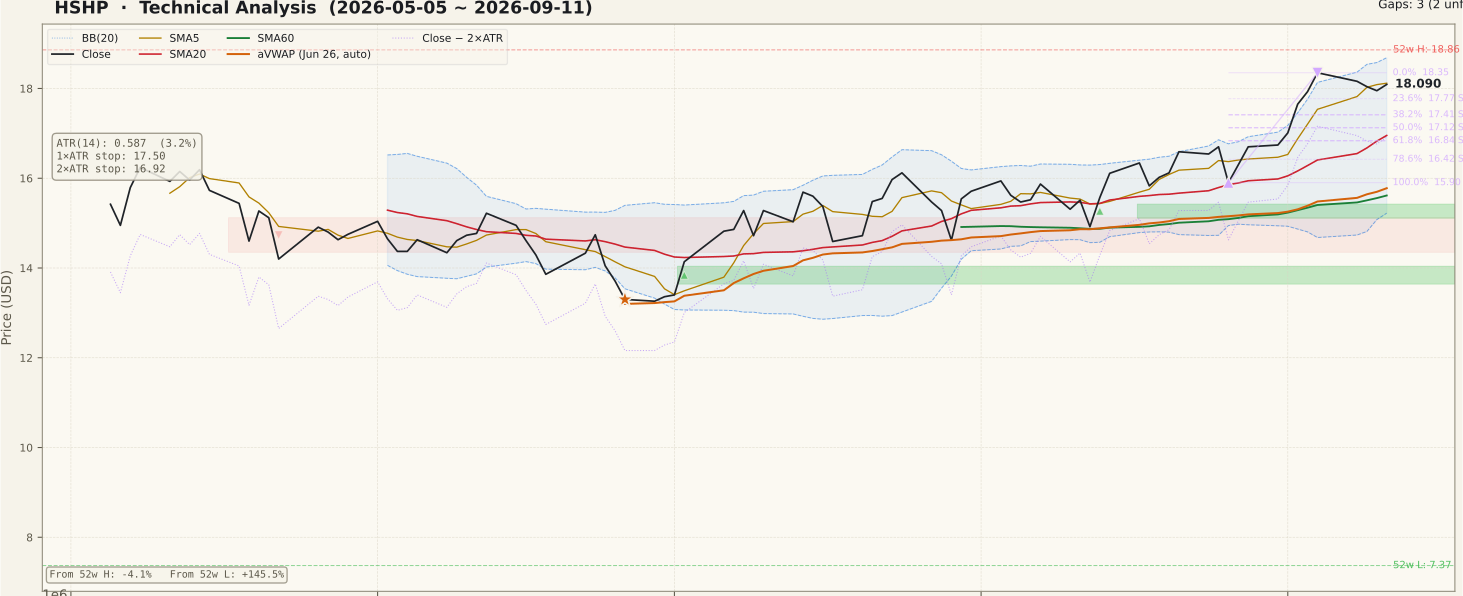
The moving-average stack is in bullish order and the spacing is wide: SMA5 $18.12 over SMA20 $16.95 over SMA60 $15.62, with the two-year panel showing all three sloping up together. What the close does not do is hold the first of them — $18.09 is 0.15% under SMA5, which is the smallest possible way to lose a line but is still the difference between "extending" and "pausing". SMA20 doubles as the Bollinger mid-band, so $16.95 is the single most important number on this chart: above it the August–September advance is intact, below it the structure changes. The upper band at $18.69 sits between the $18.35 September 4 swing high and the $18.86 52-week high, and band width of 20.43% shows the bands are already open rather than compressed.
Both anchored VWAPs are well beneath the market — $10.86 from the December 2, 2024 anchor on the two-year chart and $15.78 from the June 26, 2026 anchor on the 90-day chart — so the average buyer from either anchor is in profit and under no forced pressure to sell. Retracement levels measured across the most recent up-swing (low $15.90 on August 26, high $18.35 on September 4) put the shallow supports at $17.77 (23.6%), $17.41 (38.2%) and $17.13 (50%), with the deeper shelf at $16.84 (61.8%), $16.42 (78.6%) and $15.90 (100%). Below all of that sit two unfilled support gaps: $15.43–$15.11 from August 13 and $14.04–$13.64 from July 2. Unfilled gaps act as magnets over time, but at 15% and 25% below price they are context, not near-term levels.
② Volume

The last session traded 636,800 shares against a 20-day average of 368,340 — 1.73× normal, and it came on a session that closed near the top of the recent range rather than on a break lower. On the 90-day panel the September bars are visibly taller and more clustered than the July and August bars, which is the pattern you want to see under an advance toward a 52-week high: participation rising with price rather than price rising on a thinning tape.
Two cautions belong here. First, the absolute numbers are modest — a 368,340-share average means a single institutional order can move the ratio, so one 1.73× session is weaker evidence than a run of them, and slippage on market orders is a real cost at this size. Second, volume confirms breaks, it does not predict them: the test that matters is whether a move through the $18.35 swing high arrives with volume above that average. A breakout on below-average volume is the most common trap in this pattern, and it is worth waiting one session to see rather than assuming.
③ MACD

MACD is at 0.6698 against a signal line of 0.5652, a histogram of +0.1046, and the last cross was a golden cross on August 17, 2026. Both lines are above zero, which separates this from an early bottoming signal — a cross above zero says the shorter moving average was already leading before the crossover, and the 90-day panel shows the MACD line climbing steadily from a trough near −0.4 in late June without a dead cross since.
The honest limit of this reading is that MACD is a lagging construction of two moving averages: it will confirm what price has done and will turn only after price does. A histogram of +0.1046 against a MACD value of 0.6698 is a modest cushion, so the first flat-to-lower closes would compress it quickly. Watch the histogram rather than the crossover for the earliest change of tone.
④ RSI

RSI(14) is 66.04 on both timeframes — high, but below the 70 line. On the 90-day panel RSI pushed up to the 70 boundary during the early-September advance and has eased back while price held near its highs, which is the ordinary way a strong tape resets a momentum reading. The common beginner error here is treating a reading in the 60s as a sell signal; in a sustained uptrend RSI can hold the 55–70 band for months, and the two-year panel shows exactly that behaviour through 2025 and early 2026.
The `rsi.divergence` field is null and both divergence peaks are null, so there is no bearish RSI divergence on record — price highs and RSI highs are not yet disagreeing. That is an absence of a warning, not a positive signal. The condition that would change it is a higher price high paired with a lower RSI high, and that setup has not formed.
⑤ Mansfield Relative Strength

Because HSHP is NYSE-listed, Mansfield RS here is measured against the S&P 500, and it reads +37.60% with a rising slope — clearly on the outperform side of the zero line. Working the four-quadrant arithmetic: the prior week was 36.548, so the weekly change is +1.06 points, and the prior month was 22.002, so the monthly change is +15.60 points. Positive territory with positive change on both horizons puts this in the positive-accelerating quadrant.
The nuance is in the pace. A month that added 15.60 points and a week that added 1.06 are both improvements, but the recent step is much smaller than the monthly average pace — the leadership is intact and still widening, just not widening as fast as it did in mid-August. The two-year panel gives the longer frame: RS spent late 2024 and early 2025 deep below zero, crossed above it in mid-2025, peaked in March 2026, faded through the summer, and is now rebuilding. Relative strength is the strongest single argument on this page, and it is the one to watch for the first crack.
⑥ ATR & ADX

ATR(14) is 0.5867, or 3.243% of price. That sets the objective risk references: 1×ATR is $17.50, which is 3.24% below the close and inside ordinary daily noise, and 2×ATR is $16.92, 6.48% below. The 2×ATR line lands between the 61.8% retracement at $16.84 and the 50% at $17.13, which is a useful coincidence — a stop there is not an arbitrary percentage but sits just under the retracement shelf that the current swing would have to hold to stay a pullback.
ADX(14) is 20.19 and classified as "emerging" — below the 25 line that marks a strong trend. This is the clearest non-confirmation on the page: price is within 4.26% of a 52-week high while the trend-strength reading has stayed flat near 20 through the advance, which describes a drift higher more than a powerful directional move. ADX measures strength, not direction, so a low reading does not argue for a decline; it argues that the move has not yet earned the conviction that a breakout usually carries.
⑦ OBV

Both timeframes tag OBV as accumulation, above its 20-day moving average and rising. On the two-year frame OBV is 8,666,400 against an MA20 of 7,681,395 — a spread of 12.82%, which is a healthy but not extreme reading, and the panel shows OBV climbing alongside price since early 2026 rather than lagging it. That alignment is the point: when price makes new highs and OBV does not follow, the break is unconfirmed. Here it follows.
The 90-day figure needs a caveat rather than a headline. OBV there is 1,030,100 against an MA20 of 45,095, which produces a reported spread of 2,184.29%. That number is an artifact of a denominator near zero — the 90-day OBV series is re-based inside the window and its moving average has only just crossed through zero — so it is not comparable to the 12.82% on the two-year frame and should not be read as eighty times the accumulation. It is also worth being explicit about what this field is: `obv.divergence_pct` measures the gap between OBV and its own MA20, not a price-versus-OBV divergence. The actual divergence field, `obv.divergence`, is null on both timeframes, with both divergence peaks null — no OBV divergence is on record, in either direction.
Bull Case
- Moving averages in full bullish order — SMA5 $18.12 over SMA20 $16.95 over SMA60 $15.62 — with price 15.85% above the long-term line.
- Mansfield RS +37.60% versus the S&P 500 and rising, +15.60 points over the month and still positive week over week.
- MACD golden cross on August 17 with both lines above zero and the histogram positive at +0.1046.
- OBV in accumulation, above its MA20 and rising on both timeframes; the two-year spread of 12.82% confirms the advance with volume.
- The last session traded 1.73× the 20-day average with price only 4.08% below the $18.86 52-week high.
- Layered support beneath: the $17.77–$16.84 retracement shelf, aVWAP $15.78 clustered with the 100% level at $15.90, and unfilled gaps at $15.43–$15.11 and $14.04–$13.64.
Bear Case
- ADX 20.19 is only "emerging" — five points under the strong-trend threshold, so the move toward the high has no trend-strength confirmation.
- The close of $18.09 is 0.15% below SMA5 $18.12: the first line of the stack has already been given back.
- Limited headroom — the Bollinger upper band is 3.29% above at $18.69 and the 52-week high 4.26% above at $18.86, both between price and open sky.
- RSI 66.04 is in the upper band of its range, so the reading has little room to expand before it reaches 70.
- Price is 15.85% above SMA60 $15.62 and band width is already 20.43% — the chart is extended from its mean, not compressed.
- ATR at 3.243% of price means the whole $17.77–$16.92 zone is roughly two average sessions wide, and the 90-day OBV spread of 2,184.29% overstates the short-frame accumulation because its MA20 sits near zero.
Scenarios
| Scenario | Probability | Path | Trigger / Invalidation |
|---|---|---|---|
| Breakout continuation | 45% | Price holds above $17.77 (23.6%), clears the $18.35 September 4 swing high, then works through the $18.69 upper band toward the $18.86 52-week high. | Trigger: a close above $18.35 on volume greater than the 368,340 average. Invalidation: a close back under SMA20 $16.95. |
| Sideways consolidation | 35% | Price oscillates between roughly $16.95 and $18.35 while RSI works off its 66.04 reading and the rising SMA20 closes the 6.70% gap to price from below. | Trigger: repeated rejections at $18.35 without losing $17.13 (50%). Invalidation either way: a decisive close outside that band. |
| Failed breakout | 20% | The 23.6% and 38.2% levels give way, price returns to the SMA20 / mid-band at $16.95, and a break there opens the $16.42–$15.90 shelf and the August 13 gap at $15.43–$15.11. | Trigger: a close below $17.41 (38.2%). Invalidation of the bullish structure: the 2×ATR line at $16.92. |
Key Levels
| Level | Role | Basis |
|---|---|---|
| $18.86 | Resistance | 52-week high — 4.26% above the close |
| $18.69 | Resistance | Bollinger upper band, 3.29% above the close |
| $18.35 | Resistance | September 4 swing high; 0% anchor of the current retracement swing |
| $18.09 | Current | September 11, 2026 close, 0.15% under SMA5 $18.12 |
| $17.77 | Support | 23.6% retracement of the $15.90–$18.35 swing |
| $16.95 | Support | SMA20 and Bollinger mid-band — the structural line of the advance |
| $16.92 | 2×ATR stop | Objective invalidation, 6.48% below the close, just under the 61.8% level at $16.84 |
What to Watch
- $18.35 with volume. A move through the September 4 swing high on more than the 368,340-share average is confirmation; the same move on light volume is the unconfirmed break that so often reverses.
- ADX through 25 — or back under 20. A rise past 25 would finally align trend strength with the price structure. A drift lower while price stalls would say the advance was momentum without conviction.
- SMA5 at $18.12. Reclaiming it keeps the September 4–11 stall a pause; repeated closes beneath it turn the pause into a retracement toward the $17.77–$17.13 band.
- RSI behaviour at 70. A push through 70 alongside new price highs is continuation. A higher price high against a lower RSI high would be the first divergence — the field is null today, so this is a watch item, not a condition.
- Mansfield RS versus 36.55. The prior-week value is the reference: staying above it keeps the leadership widening, slipping under it turns a positive-accelerating reading into a positive-slowing one.
Conclusion
Past Analyses of This Stock same ticker · newest first
Other signals from this issue same publication date · 5 stocks
This analysis is an educational interpretation of chart data and is not investment advice. Probabilities and levels are subjective estimates; every investment decision, and its outcome, is your own responsibility. Chart indicators describe what price has already done — they cannot account for company news, earnings or regulatory events that have not yet occurred.
Two Week Swing · twoweekswing.com · 4,600+ stocks screened weekly