Precigen, Inc.
$7.75 −6.3% from the 52-week high of $8.27 · +159.2% from the 52-week low of $2.99
This analysis is based on closing-price data as of September 25, 2026. Whether you're researching how to buy Precigen, Inc. stock or you've just opened a brokerage account and are trying to time an entry, here are objective support levels and stop-loss references built from the RSI, MACD and ATR indicators.
On the two-year chart Precigen is a stock that re-rated from around $1 to the $4 area in August 2025, spent most of the following year basing between roughly $3 and $5, and has been climbing again since May 2026 — the close of $7.75 is +159.2% above the 52-week low and only −6.3% below the 52-week high of $8.27. The intermediate trend is the durable part of the picture: SMA20 has held above SMA60 since April 24, 2026, and Mansfield relative strength reads +50.4% against the Nasdaq Composite. The short-term part is younger than it looks. The full SMA5 > SMA20 > SMA60 stack only completed on September 17, on the same session as a MACD golden cross, and a bearish RSI divergence is flagged between the August 7 and September 22 peaks. This page reads the setup as a trend pullback that has so far held its shelf, with a momentum warning attached.
Snapshot all figures from the chart JSON · as of September 25, 2026
| Close | $7.75 |
|---|---|
| 52-week high / low | $8.27 (−6.3%) / $2.99 (+159.2%) |
| SMA5 / SMA20 / SMA60 | $7.70 / $7.23 / $6.50 — close > SMA5 > SMA20 > SMA60 (full stack since Sep 17, 2026) |
| Bollinger (20) | Upper $8.06 · Mid $7.23 · Lower $6.40 · width 23.0% |
| aVWAP — 90d | $7.15 (anchor Aug 5, 2026) — price above |
| aVWAP — 2y | $4.42 (anchor Aug 15, 2025) — price well above |
| RSI (14) | 61.2 — above 50, below 70 · bearish divergence flagged (Aug 7 vs Sep 22) |
| Mansfield RS | +50.4% vs the Nasdaq Composite · outperform · slope rising · prior week 55.96 · prior month 47.51 |
| MACD (12,26,9) | MACD 0.282 · Signal 0.254 · Histogram +0.028 · golden cross Sep 17, 2026 |
| ADX (14) | 25.0 (90d) / 24.7 (2y) — trend emerging, direction-neutral |
| ATR (14) | $0.41 — 5.3% of price |
| OBV — 2y / 90d | Early accumulation in both, above MA20, slope flat · spread vs own MA20 3.86% (2y) / 26.8% (90d) · no OBV divergence flagged |
| Volume | 6,563,500 shares — 1.535× the 20-day average of 4,276,525 (about 1.88× after adjusting for a quiet market session) |
| Stop references | 1×ATR $7.34 (−5.3%) · 2×ATR $6.93 (−10.6%) |
① Price & Moving Averages
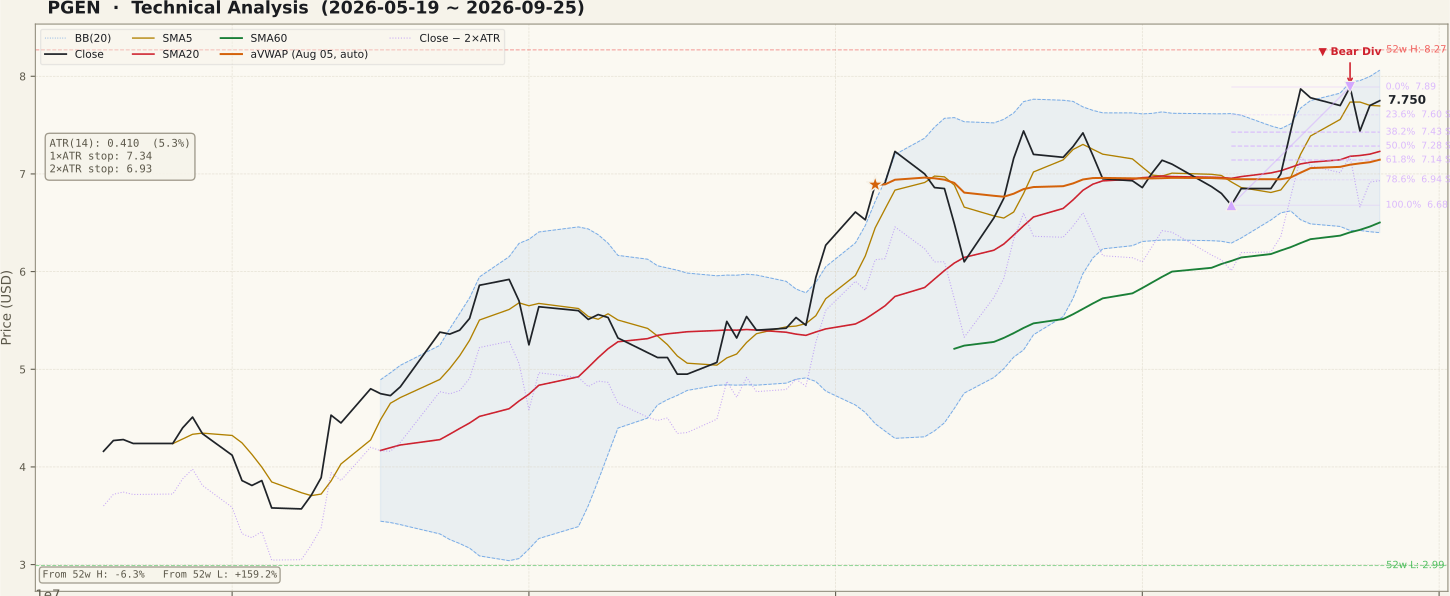
The moving averages are stacked bullishly: close $7.75 > SMA5 $7.70 > SMA20 $7.23 > SMA60 $6.50, with SMA20 rising since September 11. The conditions did not all arrive together, and their ages matter. SMA20 has been above SMA60 since April 24, 2026 (107 sessions) and the close has held above SMA60 since June 11 — that is the long-running trend this setup rests on. The last piece, SMA5 crossing above SMA20, dates from September 17, seven sessions ago and outside the five-session review window. On the panel the shape is a staircase: a July low near $4.95, a run to $7.23 by August 7, a month of sideways work between roughly $6.70 and $7.40 that pulled back to $6.68 on September 10, and then a two-session advance on September 16 and 17 from $7.00 to $7.87.
Since then price has been consolidating just under $8. It set a swing high of $7.89 on September 22, dropped −5.70% to $7.44 on September 23, and recovered to $7.75 by the base date. The September 25 session itself is worth reading carefully: it opened at $8.08, printed the new 52-week high of $8.27 intraday, and closed back at $7.75 — a rejection at the high rather than a breakout. Bollinger width is 23.0%, with the close in the upper half of the bands (mid $7.23, upper $8.06). Price sits above both anchored VWAPs — the 90-day at $7.15 (anchored August 5, 2026) and the two-year at $4.42 (anchored August 15, 2025) — so neither anchor cohort is under water. The short-term Fibonacci swing from $6.68 (September 10) to $7.89 (September 22) places the 23.6% retracement at $7.60 and the 38.2% at $7.43; the September 23 low close sat right on that 38.2% level.
② Volume

The base-date volume was 6,563,500 shares against a 20-day average of 4,276,525 — a sidecar ratio of 1.535×. Market context changes how that reads, and in this case it makes the stock look more active, not less. September 25 was a quiet session across the screened universe: the median 20-day volume ratio was 0.815× on a 400-ticker sample, after 0.89× to 0.94× on September 21 through 24. Dividing the stock's 1.535× by the market's 0.815× gives a market-adjusted ratio of roughly 1.88× — genuinely above-average participation on a day when most stocks traded below normal. The caveat is what that volume bought: the session closed well below its $8.27 high, so heavy trading met supply at the highs rather than carrying price through them.
The larger bars on the panel are the September 16 to 18 cluster. September 17 (+5.78%) printed about 2.25× raw, and September 18 about 2.27× raw — but September 18 was quadruple witching and the S&P quarterly rebalance trade date, when the universe median ratio was 1.785×, so the stock-specific reading that day was only around 1.27×. That inflated session also sits inside the current 20-day average, which raises the denominator slightly; if anything, today's 1.535× is modestly understated by it. The September 23 decline of −5.70% came on about 1.28× raw — a meaningful drop, but not a high-volume liquidation. At roughly 4.3 million shares a day, liquidity is ample for a small-cap.
③ MACD

MACD reads 0.282 against a signal line of 0.254, a histogram of +0.028. The last crossing was a golden cross on September 17, 2026, after a slide from the late-August peak visible on the panel. Both lines are well above zero, so this is a re-acceleration inside an existing uptrend rather than an early-turn cross from negative territory.
The histogram is thin, and on the panel it has been shrinking over the last few bars rather than expanding. A +0.028 gap is small relative to the swings visible earlier on this chart, which means the golden cross has not yet built much of a cushion — a few flat or soft sessions would be enough to bring the lines back together. The same panel shows two crossings in both directions during August, a reminder that crosses in a sideways stretch are frequently reversed.
④ RSI

RSI(14) is 61.2 — above the 50 midline and below the 70 overbought line, a comfortable uptrend reading with no exhaustion. The important item on this panel is the flagged bearish divergence. In the 90-day frame the first peak is August 7, 2026 at a price of $7.23 with RSI 78.61; the second is September 22, 2026 at $7.89 with RSI 69.30 (the two-year frame reports the same dates with RSI 78.25 and 69.27). Price made a higher high while RSI made a lower high.
That pattern says the September advance carried less momentum than the August one. It is a warning, not a verdict: bearish divergences inside strong trends often resolve with a sideways pause while the oscillator resets, and they are only confirmed when price actually turns — for example, a close back below the $7.43 retracement level. Until then, the right reading is that the trend is intact and the momentum behind the latest leg is weaker than the leg before it.
⑤ Mansfield Relative Strength

Mansfield RS reads +50.4% against the Nasdaq Composite — the correct benchmark for a Nasdaq listing — with state "outperform" and slope "rising". The two-year and 90-day frames agree on the same value, as they should for an anchor-free measure. On the 90-day panel the line has stayed above zero since mid-June, which is exactly the persistence this screen's RS filter looks for.
The rate of change is split, and both halves belong here. Against the prior week's 55.96 the reading is 5.58 points lower — positive territory but slowing, the September 23 drop showing up in the measure. Against the prior month's 47.51 it is 2.87 points higher — positive and accelerating. So the one-month leadership trend is still improving, while the last week gave a little of it back. Neither reading is close to the zero line.
⑥ ATR & ADX

ATR(14) is $0.41, or 5.3% of price, and the panel shows it climbing sharply over the final sessions back toward its August peak — the September 23 and 25 ranges ($7.19 to $8.01 and $7.63 to $8.27) did that. The stop arithmetic follows directly: 1×ATR sits at $7.34 (−5.3%) and the objective 2×ATR reference at $6.93 (−10.6%). Any tighter stop sits inside one ordinary day's range for this stock.
ADX(14) reads 25.0 on the 90-day frame and 24.7 on the two-year frame — right at the boundary between a forming and an established trend, tagged "emerging". ADX measures strength, not direction, and a reading this low after a four-month advance says the climb has been a series of steps and pauses rather than a steep, one-way trend. Rising volatility on a flat ADX is typical of a contested range near highs.
⑦ OBV

On-balance volume is tagged early accumulation with a flat slope in both frames, but the two distances differ a lot. In the 90-day frame OBV is 52,035,500 against an MA20 of 41,036,015 — a spread of 26.8%. In the two-year frame it is 295,924,000 against 284,924,515 — only 3.86%. The difference is mostly a scale effect (the two-year cumulative total is far larger, so the same recent buying is a smaller share of it), but both agree that volume on up days has outweighed volume on down days recently.
That spread figure is the distance between OBV and its own 20-day average — a measure of accumulation
intensity — and it is not a divergence. The sidecar reports obv.divergence as
null in both frames, so no OBV divergence is flagged. The contrast with RSI is useful:
momentum (RSI) is fading at the highs while the volume-weighted flow (OBV) is not, which argues against
reading the RSI divergence as distribution.
Bull Case vs Bear Case
Bull Case
- Full stack: close $7.75 > SMA5 $7.70 > SMA20 $7.23 > SMA60 $6.50, with SMA20 above SMA60 since April 24.
- Mansfield RS +50.4% vs the Nasdaq Composite, above zero since mid-June, up 2.87 points on the month.
- MACD golden cross on Sep 17 with both lines well above zero.
- Base-date volume 1.535×, about 1.88× after adjusting for a quiet market session.
- OBV above its MA20 in both frames (+26.8% / +3.86%), early accumulation, no OBV divergence.
- The Sep 23 pullback held the 38.2% retracement ($7.43) and recovered; price is above both aVWAPs ($7.15 / $4.42).
Bear Case
- Bearish RSI divergence: Aug 7 $7.23 / RSI 78.61 vs Sep 22 $7.89 / RSI 69.30.
- Sep 25 printed the 52-week high of $8.27 intraday and closed at $7.75 — a rejection, on above-average volume.
- The short-term stack is only seven sessions old; SMA5 crossed SMA20 on Sep 17, a session for which no catalyst was identified.
- MACD histogram is only +0.028 and has been shrinking.
- RS slipped 5.58 points week over week (positive but slowing).
- ATR 5.3% of price and rising; the 2×ATR reference is 10.6% below, and ADX 25.0 shows no strong trend.
Scenarios
| Scenario | Probability | Path | Trigger / Invalidation |
|---|---|---|---|
| Trend resumes through the high | 40% | The pullback shelf at $7.43 to $7.60 holds, MACD re-widens, and price clears the $7.89 swing high and the $8.27 intraday 52-week high. | Trigger: a daily close above $8.27 on above-average volume. Invalidation: close below $7.43. |
| Range under the high | 35% | The RSI divergence resolves sideways: price oscillates between the SMA20 / mid-band at $7.23 and $8.27 while SMA20 catches up and RSI resets. | Trigger: closes contained between $7.23 and $8.27. Invalidation: a decisive close outside either edge. |
| Divergence confirms, deeper pullback | 25% | Price loses the 38.2% level and SMA20, confirming the divergence, and works toward the 2×ATR reference at $6.93 and the September 10 low near $6.68. | Trigger: close below SMA20 $7.23. Invalidation: reclaim and hold above $7.89. |
Key Levels nearest to the close first, listed high to low
| Price | Role | Basis | Distance |
|---|---|---|---|
| $8.27 | Resistance | 52-week high (intraday, Sep 25, 2026) | +6.7% |
| $7.89 | Resistance | Sep 22, 2026 swing high · 0% of the $6.68 → $7.89 up-swing | +1.8% |
| $7.75 | Current | Close of September 25, 2026 | — |
| $7.60 | Support | 23.6% retracement of the $6.68 → $7.89 up-swing | −1.9% |
| $7.43 | Support | 38.2% retracement · Sep 23 close area | −4.2% |
| $7.23 | Support | SMA20 / Bollinger mid-band (50% retracement $7.28 just above) | −6.7% |
| $6.93 | 2×ATR stop | Objective invalidation reference, 2 × ATR $0.41 | −10.6% |
Below the stop, SMA60 at $6.50 and the September 10 swing low at $6.68 mark the intermediate trend. The only unfilled gap on the two-year chart, $1.95 to $2.51 dated August 15, 2025, is far below and is context rather than a working level.
What to Watch
- A close above $8.27. The September 25 session touched it and faded; a close through it on above-average volume would turn the rejection into a breakout.
- The $7.43 retracement. It held on September 23. A close below it would be the first price confirmation of the RSI divergence.
- The MACD histogram at +0.028. Watch whether it widens again or narrows toward a cross back below the signal line.
- RSI on any new high. A new price high with RSI above the 69.30 of September 22 would neutralise the divergence; another lower RSI peak would deepen it.
- Company disclosures. No catalyst was identified for the September 17 session that completed the moving-average stack; any later explanation would change how that bar should be read.
Conclusion
Past Analyses of This Stock same ticker · newest first
Other signals from this issue same publication date · 5 stocks
This analysis is an educational interpretation of chart data and is not investment advice. Probabilities and levels are subjective estimates; every investment decision, and its outcome, is your own responsibility. All figures are derived from closing-price data through September 25, 2026 and are not updated after publication.
Two Week Swing · twoweekswing.com · 4,600+ stocks screened weekly