BBB Foods Inc.
$53.56 −0.81% from the 52-week high of $54.00
This analysis is based on closing-price data as of September 25, 2026. Whether you're researching how to buy BBB Foods Inc. stock or you've just opened a brokerage account and are trying to time an entry, here are objective support levels and stop-loss references built from the RSI, MACD and ATR indicators.
BBB Foods, the operator of Mexico's Tiendas 3B hard-discount grocery chain, closed at $53.56 — 0.81% under a 52-week high of $54.00 that was printed intraday on the same session, and 124.9% above the 52-week low of $23.81. The two-year picture is a base-to-advance transition that accelerated in August, and the trend structure underneath is mature: moving averages in bullish order since August 4 (38 sessions). The breakout itself is not: the close has been above its prior 20-session high for only two sessions (since September 24), the heavy volume on that first breakout day has no identified cause, MACD has not confirmed, and RSI records a bearish divergence against the August 13 peak. This is an established trend with a very young, unconfirmed breakout on top.
Snapshot all figures as of the September 25, 2026 close
| Metric | Value | Read |
|---|---|---|
| Close | $53.56 | Above the Aug 25 swing high ($50.91); new closing high |
| 52-week high / low | $54.00 / $23.81 | −0.81% from high · +124.9% from low |
| SMA 5 / 20 / 60 | $52.43 / $50.88 / $45.85 | Bullish order: close > 5 > 20 > 60, held since Aug 4 (38 sessions) |
| Bollinger upper / mid / lower | $53.47 / $50.88 / $48.29 | Close 0.17% above the upper band; width 10.19% |
| aVWAP — 90d (anchor Aug 13, 2026) | $50.04 | Price 7.0% above the short-term anchored VWAP |
| aVWAP — 2y (anchor May 29, 2026) | $44.08 | Price 21.5% above the long-term anchor |
| RSI(14) | 67.82 | Just under 70, with a bearish divergence vs Aug 13 (76.81) |
| Mansfield RS vs the S&P 500 | +33.75% | Outperform, rising (prev week 31.25 · prev month 26.96) |
| MACD / signal / histogram | 1.514 / 1.534 / −0.020 | Still below signal; last cross = dead cross Aug 31, 2026 |
| ADX(14) | 33.50 | Strong trend (>25) |
| ATR(14) | $1.64 (3.06% of price) | Daily range budget for position sizing |
| OBV — 2y / 90d | Early accumulation, above MA20, flat / Early accumulation, above MA20, flat | Positive placement, no slope yet; no OBV divergence recorded |
| Volume (last / 20-day avg) | 1,050,600 / 593,945 | 1.769× raw; about 2.17× after the quiet-market adjustment in ② |
| 1× / 2× ATR stop | $51.92 / $50.28 | 2× ATR sits 6.13% below the close |
① Price & Moving Averages
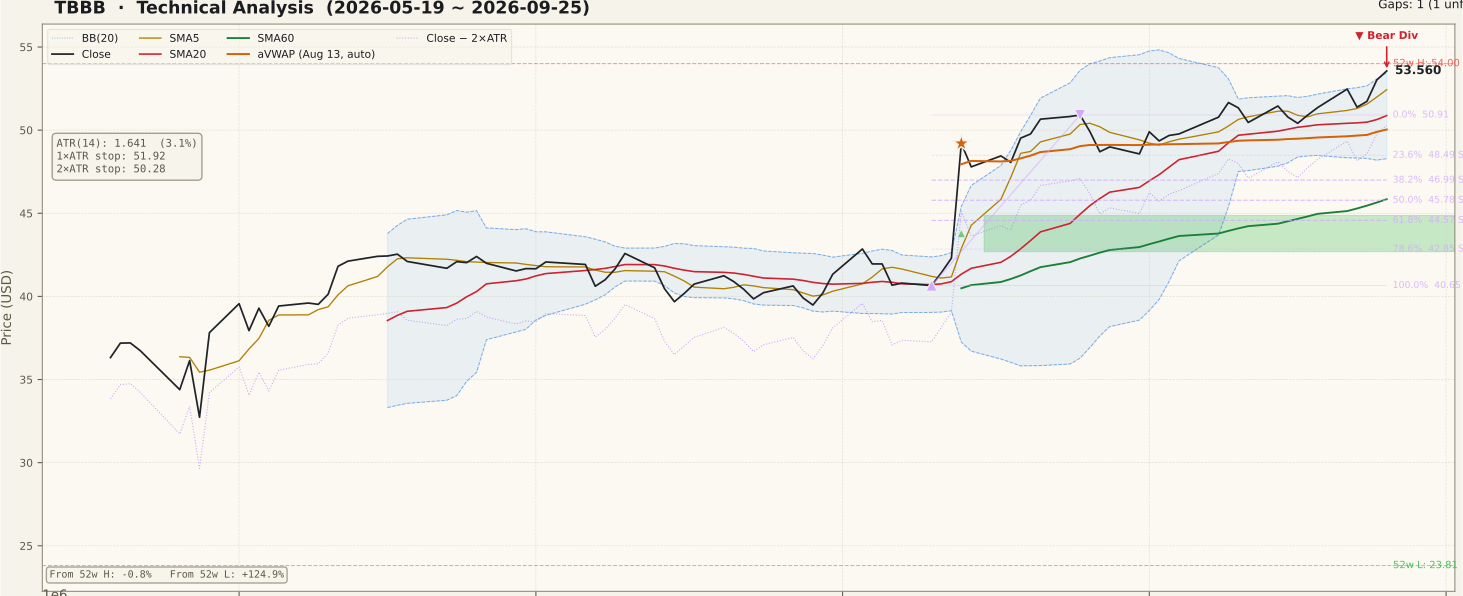
The averages are stacked in bullish order — close $53.56 > SMA5 $52.43 > SMA20 $50.88 > SMA60 $45.85 — and each condition has its own formation date. The close has held above SMA60 since July 30 and above SMA20 since August 11; the full SMA5 > 20 > 60 alignment first held on August 4 and has been intact for 38 sessions. The 20-day-high breakout that put the stock on the screen is far younger: the close first exceeded its prior 20-session maximum (the September 21 close of $52.47) on September 24, so as of the base date the breakout is two sessions old.
The 90-day panel shows the shape behind those dates. A flat $39–$43 range through July gave way to the August 13 session, a +16.3% move on Q2 results day that left an unfilled gap between $42.68 and $44.88. That event sits well outside the last five sessions and is the historical origin of the current leg, not a recent shock. After it, price stair-stepped to the August 25 swing high at $50.91, pulled back toward $48.57, and then spent most of September drifting sideways just above $50 before this week's push. Friday closed 0.17% above the upper Bollinger band ($53.47) with the band width at 10.19%, so the break is out of a comparatively tight September range rather than out of an already-stretched expansion. On the 2-year panel the stock is at the top of its entire history on the chart, with no price-based overhead reference beyond the $54.00 high.
② Volume

The base session traded 1,050,600 shares against a 20-day average of 593,945 — a ratio of 1.769×. The session before it, September 24, was the heavier bar: 1,566,300 shares, about 2.94× the average, on the first breakout close (+2.49%). Both readings sit on a quiet market. Across the screening universe the median volume ratio was 0.904× on September 24 and 0.815× on September 25 (400-ticker sample), so TBBB's Friday participation, adjusted for the subdued tape, is closer to 2.17×, and Thursday's roughly 3.25×. There is a second, smaller distortion in the denominator: September 18 was quadruple witching plus the S&P rebalance (market median 1.785×), and that session is inside the 20-day average, which slightly inflates the baseline. Neither correction weakens the reading; this is genuinely above-average activity.
What the volume does not have is an explanation. No specific catalyst was found for the September 24 spike — no results, no filing and no corporate event identified — and the page does not assert one. The price response was also modest for the size of the print: +2.49% on nearly 3× volume, then +1.02% the following day. The last five sessions ran +2.18%, −2.08%, +0.68%, +2.49% and +1.02%, with no bar near the 8% review threshold. Heavy volume with a small move and no known cause can be early accumulation, block repositioning or anything in between; it is a question to answer, not a confirmation to bank.
③ MACD

MACD has not confirmed this breakout. On the base date MACD reads 1.514 against a signal line of 1.534, a histogram of −0.020, and the last crossover on record is a dead cross on August 31, 2026. The 90-day panel shows why: MACD peaked in late August after the results gap, then decayed for most of September while price moved sideways, and only in the final sessions turned back up toward the signal line.
The histogram has shrunk to almost nothing, so a golden cross could arrive within a session or two if price holds. That is a possibility, not a fact, and the distinction matters for a two-session breakout. Both lines are still well above zero, which describes an intact but cooled trend rather than a fresh impulse. The practical read: until the histogram turns positive, the momentum gauge is lagging the price and the breakout stands on price and volume alone.
④ RSI

RSI(14) is 67.82 — firm, below the 70 overbought line, and not stretched. The more important entry is the divergence. The JSON records a bearish RSI divergence: the first peak on August 13, 2026 at a price of $49.20 with RSI 76.81, and the second on September 25, 2026 at $53.56 with RSI 67.82. Price made a higher high while RSI made a lower high (the 2-year JSON shows the same pair at 76.59 and 67.79).
Context keeps this in proportion. The first peak was a single +16.3% results-day bar, which produces an RSI spike that a gradual advance rarely matches, so part of the divergence reflects how different the two moves were rather than momentum draining away. Still, the field is set and it agrees with the MACD reading: the new price high is not being matched by the momentum oscillators. A divergence is the possibility of a top, not a confirmed one; it would gain weight only if price fails back below the September range.
⑤ Mansfield Relative Strength

Mansfield RS vs the S&P 500 stands at +33.75%, in outperform territory with a rising slope. One week ago it was 31.25 and one month ago 26.96, so RS has gained 2.50 points on the week and 6.78 points on the month — positive and rising, the accelerating quadrant.
The 90-day panel shows RS positive for almost the entire window, with the step up coming on the August 13 results bar and a plateau in the low 30s since. So the stock's outperformance is not something this week's breakout created; it has been in place for months. The screen's RS rank of 93 reflects that. The caution is that the plateau has been mostly sideways since late August, and the latest gain is modest — relative strength is holding, not surging.
⑥ ATR & ADX

ATR(14) is $1.64, or 3.06% of price. It jumped on the August results gap and has eased back since, ticking up only slightly this week — the breakout has not come with a volatility expansion. For sizing, the 1× ATR reference is $51.92 and the 2× ATR reference is $50.28, 6.13% below the close. That 2× level sits just beneath SMA20 ($50.88) and the Aug 25 swing high ($50.91), so it lines up with structure rather than floating in empty space.
ADX(14) is 33.50, labelled strong. It climbed from below 20 in early August to the mid-30s and has held there, drifting slightly lower through September's sideways stretch. ADX measures strength, not direction; here it says the August trend is still in force, but it has not re-accelerated on the breakout.
⑦ OBV

Both timeframes carry the same tag. On the 90-day window OBV is early accumulation, above its MA20 with a flat slope — OBV 20,103,700 against an MA20 of 16,789,345, a spread of 19.74%. On the 2-year window it is also early accumulation, above MA20, flat — 20,079,200 against 16,764,845, a spread of 19.77%. The 2-year panel shows OBV at the top of its range, having turned up from late May and stepped higher in August.
Two clarifications. The 19.7% figures are the spread between OBV and its own 20-day average, not a divergence
measure. Divergence is judged separately, and the JSON records no OBV divergence
(obv.divergence is null). And the visible hook at the right edge of the OBV line is largely the
September 24–25 volume being added in full on two up days — the same unexplained volume discussed in ②. Flow
placement is supportive; the flat slope says the accumulation case is still forming.
Bull vs Bear
Bull Case
- Moving averages in full bullish order since August 4 (38 sessions) — close $53.56 > SMA5 $52.43 > SMA20 $50.88 > SMA60 $45.85.
- Close above SMA60 since July 30 and above SMA20 since August 11 — the trend predates the breakout by weeks.
- Mansfield RS +33.75% vs the S&P 500 and accelerating (+2.50 week, +6.78 month).
- ADX 33.50 — a strong-trend reading that has held since August.
- Participation above average on a quiet tape: about 2.17× market-adjusted on the base date, about 3.25× on September 24.
- OBV in early accumulation above MA20 on both 2-year and 90-day windows, with no OBV divergence; price above both anchored VWAPs.
Bear Case
- The 20-day-high breakout is only two sessions old (since September 24) — too young to call established.
- MACD has not confirmed: 1.514 vs signal 1.534, histogram −0.020, last cross a dead cross on August 31.
- Bearish RSI divergence: $49.20 / RSI 76.81 on Aug 13 vs $53.56 / RSI 67.82 on Sep 25.
- The September 24 volume spike (about 2.94× raw) has no identified cause, and it moved price only +2.49%.
- Close is 0.17% above the upper Bollinger band and 0.81% under the intraday 52-week high set the same day.
- The 2× ATR invalidation is 6.13% away; SMA60 sits about 4.7 ATRs below the close.
Scenarios
| Scenario | Probability | Path | Trigger / Invalidation |
|---|---|---|---|
| Breakout follows through | 35% | Price clears the $54.00 52-week high, MACD crosses back above its signal line, and the Bollinger band begins to walk higher with SMA5 rising beneath price. | Trigger: a close above $54.00 together with a positive MACD histogram. Invalidation: a close back below the 1× ATR reference at $51.92. |
| Back into the September range | 40% | The two-session breakout stalls under $54.00, price slips back into the $50–$52.5 September range, and SMA20 catches up while the RSI divergence resolves sideways. | Trigger: a close below SMA5 $52.43 without a MACD cross. Invalidation: a close below SMA20 $50.88. |
| Failed breakout | 25% | The breakout reverses, the unexplained volume turns out to be distribution, and price falls through SMA20 and the 90-day aVWAP toward the 23.6% retracement at $48.49. | Trigger: a close below the 2× ATR reference at $50.28. Invalidation of this bearish path: a close back above $53.56. |
Probabilities are subjective estimates derived from the chart structure, not statistical forecasts.
Key Levels
| Price | Role | Basis |
|---|---|---|
| $54.00 | Resistance | 52-week high, set intraday on Sep 25 — 0.81% overhead |
| $53.56 | Current close | Sep 25, 2026 close; 0.17% above the upper Bollinger band ($53.47) |
| $52.43 | Support | SMA5; 1× ATR stop just below at $51.92 |
| $50.91 | Pivot (prior resistance) | Aug 25 swing high = 0% anchor of the Aug 10 → Aug 25 up-swing; SMA20 / Bollinger mid just below at $50.88 |
| $50.28 | 2× ATR stop | Objective invalidation — 6.13% below the close |
| $50.04 | Support | 90-day anchored VWAP (anchor Aug 13, 2026 results day) |
| $48.49 | Support | 23.6% retracement of the $40.65 → $50.91 swing |
What to Watch
- Whether the breakout survives its first week. Two sessions above the prior 20-day high is the entire breakout record. Holding above SMA5 ($52.43) through the next few sessions matters more than any single day.
- A MACD cross above the signal line. The histogram is at −0.020. A positive turn would give the breakout the momentum confirmation it currently lacks; a widening negative histogram while price stalls would reinforce the RSI divergence.
- The $54.00 high. It was set intraday on Friday. A close above it on above-average volume is the cleanest follow-through signal; a rejection there would leave a two-day probe.
- An explanation for the September 24 volume. No catalyst was identified. Check the news and filing record independently; the absence of an identified cause is not proof there is none.
Conclusion
Past Analyses of This Stock same ticker · newest first
Other signals from this issue same publication date · 5 stocks
This analysis is an educational interpretation of chart data and is not investment advice. Probabilities and levels are subjective estimates; every investment decision, and its outcome, is your own responsibility. A breakout is not a guarantee of continuation, and a bottoming signal is not a buy signal.
Two Week Swing · twoweekswing.com · 4,600+ stocks screened weekly