GameStop Corporation
$23.39 −16.76% from the 52-week high of $28.10
This analysis is based on closing-price data as of September 25, 2026. Whether you're researching how to buy GameStop Corporation stock or you've just opened a brokerage account and are trying to time an entry, here are objective support levels and stop-loss references built from the RSI, MACD and ATR indicators.
GME closed at $23.39 after a four-week rebound from the August 28 swing low of $17.87 to a September 24 high close of $25.02 — a swing of roughly 40% that lifted the stock off the bottom of a two-year range rather than into new territory; it still sits 16.76% below the 52-week high. The trend structure is young: SMA5 has been above SMA20 since September 2, but SMA20 only crossed above SMA60 on September 24, completing the SMA5 > SMA20 > SMA60 alignment just two sessions before the base date. And the base date itself was a −6.51% session that pulled price back under SMA5 — so this is a trend-pullback setup being read on the first day of its pullback, with Mansfield RS still slightly below zero against the S&P 500.
Snapshot all figures as of the September 25, 2026 close
| Metric | Value | Read |
|---|---|---|
| Close | $23.39 | −6.51% on the base date, off the Sep 24 swing high close of $25.02 |
| 52-week high / low | $28.10 / $17.79 | −16.76% from high · +31.48% from low |
| SMA 5 / 20 / 60 | $23.88 / $21.13 / $20.58 | SMA5 > 20 > 60 in order, but the close sits below SMA5; SMA20 > SMA60 only since Sep 24 |
| Bollinger upper / mid / lower | $25.47 / $21.13 / $16.79 | Width 41.11% — a wide, expanded band after the rebound |
| aVWAP — 90d (anchor Aug 3, 2026) | $20.23 | Price 15.6% above the short-term anchored VWAP |
| aVWAP — 2y (anchor Mar 27, 2025) | $23.74 | Price 1.49% below the long-term anchored VWAP — overhead supply |
| RSI(14) | 65.11 | Back below 70 after the base-date drop; bullish divergence recorded at the August lows |
| Mansfield RS vs the S&P 500 | −4.47% | Underperform but rising — negative-improving (prev week −6.92 · prev month −27.14) |
| MACD / signal / histogram | 1.262 / 0.876 / +0.386 | Golden cross Aug 26, 2026; histogram positive but smaller on the base date |
| ADX(14) | 47.33 | Strong trend reading — nearly double the 25 threshold |
| ATR(14) | $0.88 (3.75% of price) | Rising into the base date — daily range has widened |
| OBV — 2y / 90d | Accumulation, above MA20, rising / Accumulation, above MA20, rising | Both timeframes agree; bullish OBV divergence at the August lows |
| Volume (last / 20-day avg) | 13,195,000 / 9,655,995 | 1.367× raw — about 1.68× adjusted for a quiet market session (see ②) |
| 1× / 2× ATR stop | $22.51 / $21.64 | 2× ATR sits 7.49% below the close |
① Price & Moving Averages
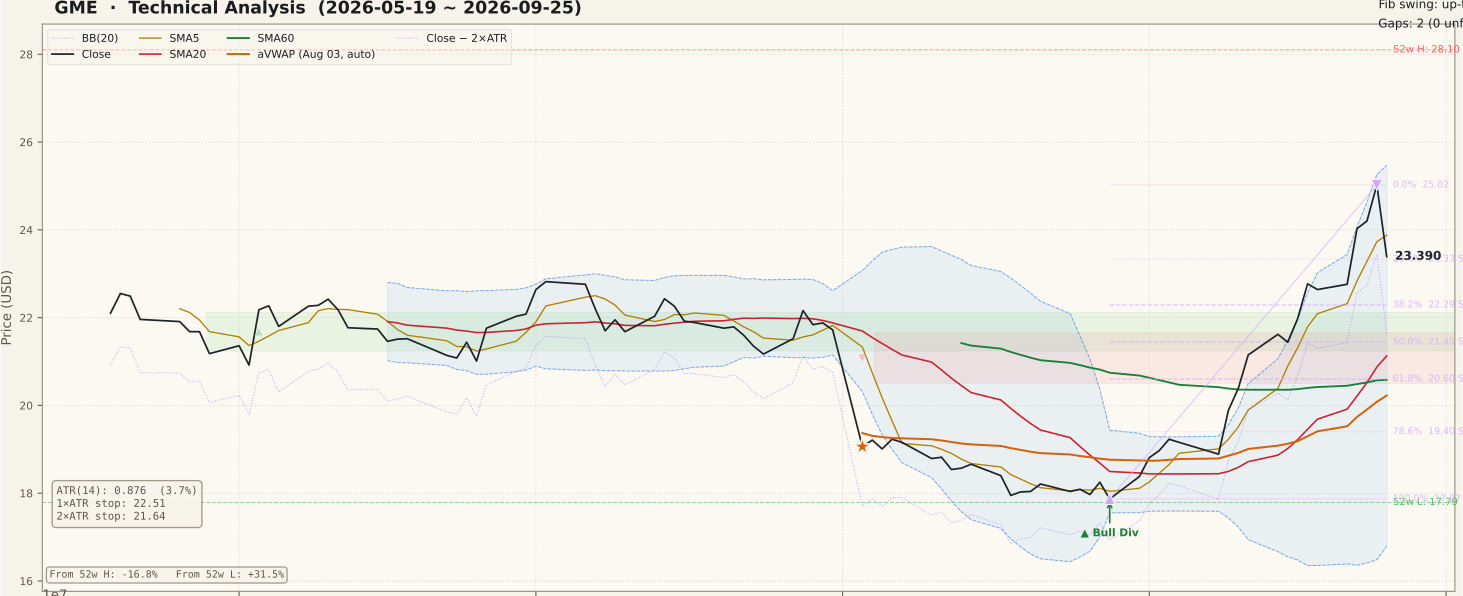
The averages now read SMA5 $23.88 > SMA20 $21.13 > SMA60 $20.58, but the dates behind that order matter more than the order itself. Each condition formed separately: SMA5 moved above SMA20 on September 2 (17 sessions), SMA20 began rising on September 8, the close has held above SMA60 since September 10, and SMA20 crossed above SMA60 only on September 24 — two sessions before the base date and the last piece to fall into place. That final cross was a slow-average cross after weeks of a rising SMA20, not the product of a single gap bar, but it is also thin: SMA20 sits just $0.55 above SMA60, well under one ATR.
The 90-day panel shows where the move came from. On August 3 GME gapped lower and closed at $19.06, down 12.25% on 41.7 million shares — the event that anchors the 90-day VWAP and started a month of basing near $18. The rebound off the August 28 low of $17.87 then carried price through SMA60 and up to $25.02 on September 24, briefly poking into the lower edge of an unfilled gap from June 12, 2025 ($24.30–$28.42) on the 2-year chart. The base-date session opened near the prior close and sold off to close at $23.39, back below that gap, below SMA5, and just above the 23.6% retracement of the swing at $23.33. The close also sits 1.49% under the 2-year anchored VWAP at $23.74, a line the 2-year panel shows price has struggled with since mid-2025.
② Volume

The base session traded 13,195,000 shares against a 20-day average of 9,655,995 — a ratio of 1.367×. Two pieces of market context change how that number reads. First, September 25 was a quiet day across the screening universe: the median 20-day volume ratio was 0.815× (400-ticker sample), after 0.89–0.94× on September 21–24. Measured against that, GME's stock-specific participation on the down day was closer to 1.68×. Second, the 20-day denominator contains September 18 — quadruple witching and the S&P quarterly rebalance, when the market-wide median ratio was 1.785× — which inflates the average slightly and makes every recent ratio read a little lower than it would otherwise.
The five-session record: +0.53%, +5.58% (1.85× raw), +0.71%, +3.39%, then −6.51% (1.41× raw) on the base date. The heaviest relative volume of the week came on the September 22 advance, and the base-date decline drew noticeably more than average participation. None of these sessions reached the 8% move or 3× volume review thresholds. The panel's standout bar remains August 3, far taller than anything in September, which is a reminder that the rebound has been built on steady above-average turnover rather than a single surge.
③ MACD

MACD reads 1.262 against a signal line of 0.876, a histogram of +0.386, and the last crossover was a golden cross on August 26, 2026 — made from below zero, near the August lows, which is the earliest and typically most durable kind of MACD turn. Both lines have since climbed well above zero, and on the 90-day panel MACD itself is at the top of its range for the period.
The base-date bar is visible here as a smaller histogram bar after a run of rising ones, and the MACD line has flattened. That is what a one-day pullback looks like on a lagging momentum indicator; it is not yet a bearish cross, and the lines are still separated by 0.386. The thing to follow is whether the histogram keeps shrinking over the next several sessions — a steady contraction toward zero while price holds would describe an orderly pause, while a contraction accompanied by closes below SMA20 would describe momentum rolling over.
④ RSI

RSI(14) is 65.11. It spent most of September above 70 during the rebound and dropped back below that line on the base-date decline — a reset from overbought rather than a breakdown, since the reading is still comfortably above 50.
The JSON records a bullish RSI divergence at the start of this move: price made a lower low from $19.01 on August 5 to $17.87 on August 28, while RSI made a higher low, from 26.70 to 27.88 (the 2-year series gives 27.04 and 28.09 for the same two dates). Both readings sat in oversold territory. In hindsight the divergence preceded the rebound, but the two RSI lows are only about one point apart — a mild divergence, and one that should be read as having described the August base, not as a signal about what happens next. A bottoming signal is not a buy signal, and this one has already played out.
⑤ Mansfield Relative Strength

Mansfield RS vs the S&P 500 stands at −4.47% — underperform, with a rising slope. One week ago the value was −6.92 and one month ago −27.14, so RS has improved by 2.45 points on the week and 22.66 points on the month. Negative and rising places GME in the negative-improving quadrant on both horizons: the stock is closing the gap with the index rather than leading it.
The panel shows RS briefly poking above zero on September 24 before the base-date drop pushed it back below. The 2-year chart puts that in context: GME has been below the zero line almost continuously since mid-2025. The month-scale improvement is large and genuine, but a reading still under zero means the rebound has so far recovered lost ground rather than established leadership. A sustained move above zero would be the confirmation this setup does not yet have.
⑥ ATR & ADX

ATR(14) is $0.88, or 3.75% of price, and the 90-day panel shows it rising steeply into the base date — the daily range has widened with the rebound and widened again on the −6.51% session. For sizing, the 1× ATR reference is $22.51 and the 2× ATR reference is $21.64, 7.49% below the close. That is a wide stop in percentage terms, and a rising ATR means the same stop distance buys less room each day.
ADX(14) is 47.33 (46.93 on the 2-year calculation), labelled strong. ADX measures trend strength, not direction; part of this reading was built during the August decline and carried into the September advance, so it confirms that GME has been moving decisively rather than confirming the up-leg alone. Readings in the high 40s are more often near a peak than a beginning, and the next development after a sharp reversal day is frequently an easing ADX as price consolidates.
⑦ OBV

Both timeframes are tagged accumulation, above MA20 and rising. On the 90-day window OBV is 64,311,400 against an MA20 of 19,028,655; on the 2-year window it is 177,948,300 against 132,665,555, a spread of 34.13%. The 90-day spread figure (237.97%) is inflated because that MA20 sits near zero — it measures distance from the moving average, not divergence, and should not be read as extraordinary buying.
Divergence is judged separately, and the JSON records a bullish OBV divergence on the same two dates as RSI: price fell from $19.01 (August 5) to $17.87 (August 28) while 90-day OBV rose from −46,024,400 to −37,509,600. Both oscillators therefore agree that selling pressure was fading into the August low. The base-date bar shows as a visible downturn in OBV from its peak, since the full 13.2 million shares counted against the line; one heavier down day does not change the tag, but a series of them would.
Bull vs Bear
Bull Case
- SMA5 $23.88 > SMA20 $21.13 > SMA60 $20.58, built step by step: SMA5 over SMA20 since Sep 2, close above SMA60 since Sep 10, SMA20 rising since Sep 8.
- MACD golden cross on Aug 26 from below zero, histogram still positive at +0.386.
- Bullish divergence on both RSI and OBV at the Aug 5 / Aug 28 lows — fading selling pressure before the rebound.
- OBV in accumulation on both the 2-year and 90-day windows, above MA20 and rising.
- Mansfield RS improved 22.66 points in a month (−27.14 to −4.47) and is rising.
- CEO Ryan Cohen disclosed buying about 1.15 million shares at roughly $22.94 (about $26.4M) — an insider purchase near current prices.
Bear Case
- The SMA20 > SMA60 cross completed only on Sep 24, two sessions before the base date, and the two averages are just $0.55 apart.
- The base date was a −6.51% session on above-average volume (about 1.68× market-adjusted), closing below SMA5.
- Price was turned back at the lower edge of the unfilled June 2025 gap ($24.30–$28.42) and closed 1.49% below the 2-year anchored VWAP at $23.74.
- Mansfield RS is still below zero (−4.47%) — improving, not leading.
- The note exchange adds about 55.5 million new shares (plus about $358.4M cash) for roughly $1.4B of 0% convertibles — dilution at the share level.
- Fiscal Q2 revenue fell 19% year over year to $790.2M; the 2× ATR stop sits a wide 7.49% below the close with ATR still rising.
Scenarios
| Scenario | Probability | Path | Trigger / Invalidation |
|---|---|---|---|
| Shallow pullback holds | 35% | The base-date drop is absorbed near the 23.6% ($23.33) to 38.2% ($22.29) retracement band, SMA5 flattens and price turns back toward $25.02 and the gap edge at $24.30. | Trigger: a close back above SMA5 $23.88 on lighter volume than the base date. Invalidation: a close below $22.29. |
| Deeper retest of the averages | 40% | The pullback extends into the $21.13–$21.45 zone (SMA20 and 50% retracement), testing whether the new SMA20 > SMA60 order survives; ADX eases from the high 40s. | Trigger: continued closes below $23.33 with a shrinking MACD histogram. Invalidation of the setup: a close below the 2× ATR stop at $21.64 followed by SMA20 slipping back under SMA60. |
| Failed rebound | 25% | The Sep 24 high marks the top of the rebound at the old gap; price loses SMA20 and SMA60 and drifts back toward the 61.8% retracement at $20.60 and the 90-day anchored VWAP at $20.23. | Trigger: a close below SMA60 $20.58 on rising volume. Invalidation of this bearish path: a close above $25.02. |
Probabilities are subjective estimates derived from the chart structure, not statistical forecasts.
Key Levels
| Price | Role | Basis |
|---|---|---|
| $25.02 | Resistance | Sep 24 swing high close — 0% anchor of the current up-swing |
| $24.30 | Resistance | Lower edge of the unfilled gap from Jun 12, 2025 ($24.30–$28.42) |
| $23.88 | Resistance | SMA5 — price closed below it on the base date; 2-year aVWAP $23.74 sits just beneath |
| $23.39 | Current close | Sep 25, 2026 close, after a −6.51% session |
| $23.33 | Support | 23.6% retracement of the $17.87 → $25.02 swing |
| $22.29 | Support | 38.2% retracement; 1× ATR reference sits just above at $22.51 |
| $21.64 | 2× ATR stop | Objective invalidation — 7.49% below the close; SMA20 $21.13 and the 50% retracement $21.45 lie just below |
What to Watch
- Follow-through after the −6.51% day. Whether the next sessions stabilise above the 23.6% retracement at $23.33 or keep falling on above-average volume is the clearest early read on whether this is a pause or a reversal.
- The SMA20 / SMA60 spread. The cross is two sessions old and the gap is $0.55. The alignment only means something if SMA20 keeps pulling away; a quick re-cross would undo the setup.
- The $24.30 gap edge and the $23.74 anchored VWAP. Both turned price back this week. A close back above $24.30 would reopen the path into the June 2025 gap.
- Mansfield RS crossing zero. The rebound has recovered relative ground but not yet produced outperformance against the S&P 500.
- Share-count changes from the note exchange. Settlement of the roughly 55.5 million new shares is a known supply event; check the filings rather than inferring its effect from the chart.
Conclusion
Past Analyses of This Stock same ticker · newest first
Other signals from this issue same publication date · 5 stocks
This analysis is an educational interpretation of chart data and is not investment advice. Probabilities and levels are subjective estimates; every investment decision, and its outcome, is your own responsibility. A bottoming signal is not a buy signal, and a rebound is not a guarantee of continuation.
Two Week Swing · twoweekswing.com · 4,600+ stocks screened weekly