Allient Inc.
$116.01 −2.2% from the 52-week high of $118.67 · +177.9% from the 52-week low of $41.75
This analysis is based on closing-price data as of September 25, 2026. Whether you're researching how to buy Allient Inc. stock or you've just opened a brokerage account and are trying to time an entry, here are objective support levels and stop-loss references built from the RSI, MACD and ATR indicators.
Over two years Allient has climbed from the high teens to $116.01, and its Mansfield relative strength of +47.2% against the Nasdaq Composite says this has been a leader, not a laggard, for most of that run. The close on September 25 is the highest close in the chart's one-year window, above the August 12 closing peak of $114.28, and it cleared the prior 20-session high for the first time on that same bar. That is the honest size of this breakout: one session old. The full SMA5 > SMA20 > SMA60 alignment only completed on September 22, four sessions before the base date, and almost every bullish condition on this page formed within the last seven sessions. Volume on the breakout day was 0.96× its 20-day average, and RSI has already flagged a bearish divergence against the August peak, so this page reads the setup as young and unconfirmed rather than established.
Snapshot all figures from the chart JSON · as of September 25, 2026
| Close | $116.01 |
|---|---|
| 52-week high / low | $118.67 (−2.2%) / $41.75 (+177.9%) |
| SMA5 / SMA20 / SMA60 | $111.92 / $98.35 / $95.87 — close > 5 > 20 > 60, but SMA20 crossed above SMA60 only on Sep 22 and the gap between them is $2.48 |
| Bollinger (20) | Upper $116.03 · Mid $98.35 · Lower $80.67 · width 35.96% — close sits on the upper band |
| aVWAP — 90d | $102.79 (anchor Aug 6, 2026) — price above |
| aVWAP — 2y | $90.44 (anchor May 7, 2026) — price above |
| RSI (14) | 68.1 — just under 70 · bearish divergence flagged (Aug 12 $114.28 / RSI 73.75 → Sep 25 $116.01 / RSI 68.09) |
| Mansfield RS | +47.2% vs the Nasdaq Composite · outperform · slope rising · prior week 32.05 · prior month 29.61 |
| MACD (12,26,9) | MACD 4.226 · Signal 1.816 · Histogram 2.410 · golden cross Sep 17, 2026 |
| ADX (14) | 21.7 — trend emerging (direction-neutral) |
| ATR (14) | $5.47 — 4.7% of price |
| OBV — 2y / 90d | Accumulation, above MA20, rising in both frames · spread vs own MA20: 8.92% (2y) / 18.18% (90d) · bullish OBV divergence flagged in both frames |
| Volume | 218,800 shares — 0.96× the 20-day average of 227,170 (about 1.18× after adjusting for a quiet market session; see ②) |
| Stop references | 1×ATR $110.54 (−4.7%) · 2×ATR $105.07 (−9.4%) |
① Price & Moving Averages
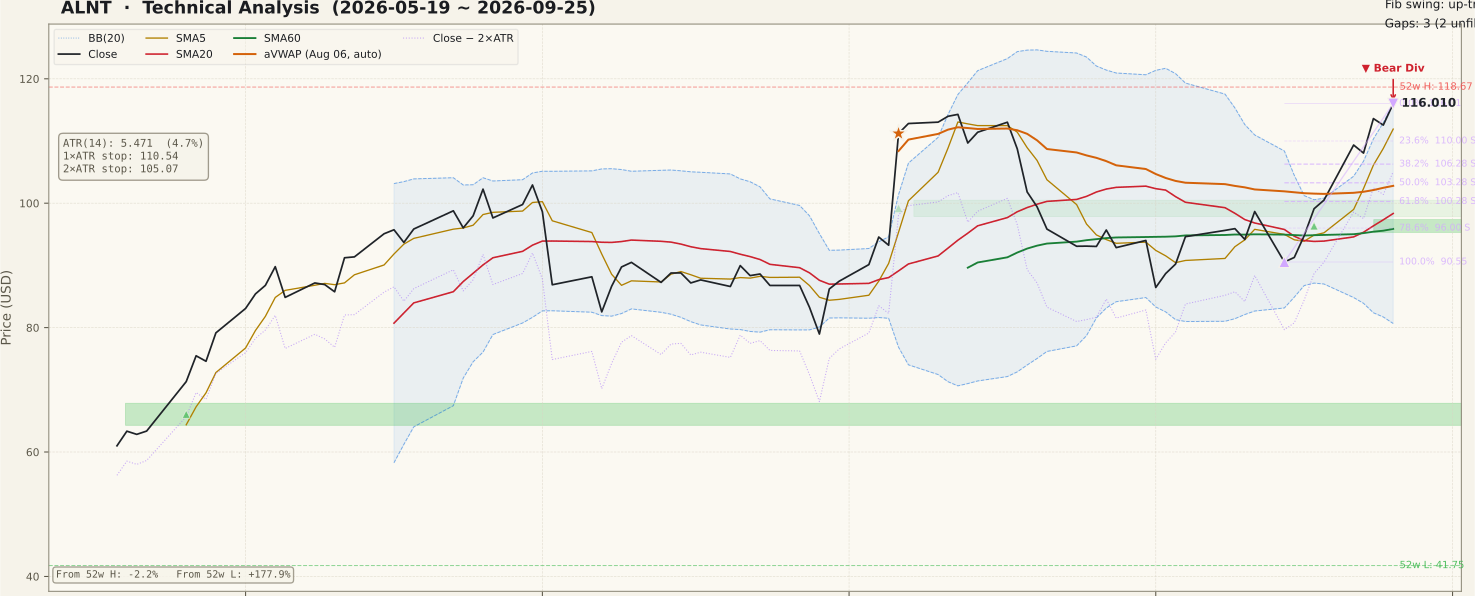
The two-year picture is a persistent staircase higher, with a sharp August 6 jump of about +19% (well outside the recent window) that carried the stock to the $118.67 intraday high, followed by a slide to the September 14 swing low of $90.55. From that low the stock has run straight back up: +4.59% on Sep 17, +1.39% on Sep 18, +8.82% on Sep 21, −1.18% on Sep 22, +5.13% on Sep 23, −0.92% on Sep 24 and +3.07% on Sep 25. No specific catalyst was identified for the Sep 21 or Sep 23 sessions. The stack now reads close $116.01 > SMA5 $111.92 > SMA20 $98.35 > SMA60 $95.87, but each piece is fresh: close above SMA20 since Sep 16, above SMA60 and SMA5 above SMA20 since Sep 17, SMA20 rising since Sep 18, and SMA20 above SMA60 only since Sep 22. The close is also pressed against the upper Bollinger Band ($116.03), with the band width at 35.96% — a wide, stretched envelope rather than a squeeze. An unfilled support gap from Sep 17 sits at $95.31-$97.36, right beside SMA20 and SMA60.
② Volume

The breakout bar printed 218,800 shares, 0.96× the 20-day average of 227,170 — by the textbook rule, a breakout on below-average volume is one to treat with suspicion. Two context points soften that, but only partly. First, Sep 25 was a quiet day across the market: the median stock in a 400-ticker universe sample traded at 0.815× its own 20-day average, so ALNT's reading is roughly 1.18× on a market-adjusted basis. Second, the 20-day denominator includes Sep 18, a quadruple-witching and index-rebalance session when market-wide volume ran near 1.8× normal, which inflates the average slightly. Even after both adjustments, this is ordinary participation, not an emphatic one. The Sep 21 +8.82% session was 1.08× raw (around 1.2× adjusted), and the heaviest recent bar relative to its average was the Sep 24 down day at 1.58×.
③ MACD

MACD (4.226) crossed above its signal line (1.816) on Sep 17, from slightly below zero, and the histogram has widened every week since to 2.410. That is the clean part of the momentum story: the cross came near the zero line rather than from an extended level, and the lines are now separating. The caveat is the same as for the moving averages — the cross is seven sessions old. In early July and again in mid-August, MACD rose steeply to the 6-7 area and then rolled over into a dead cross within a few weeks, so a steep MACD alone has not been a durable signal on this chart.
④ RSI

RSI stands at 68.1, just under the 70 overbought line, after climbing steadily from the mid-40s in mid-September. The chart flags a bearish RSI divergence: on Aug 12 price closed at $114.28 with RSI at 73.75, and on Sep 25 price made a higher close at $116.01 while RSI printed a lower 68.09 (the 2-year frame reads 73.46 and 68.06, the same pattern). A divergence is a possibility of fading momentum, not a confirmed top — it needs price to actually turn and lose a level before it means anything. Still, it is the most direct warning on this page that the new high is being reached with less force than the August one.
⑤ Mansfield Relative Strength

Mansfield RS vs the Nasdaq Composite is +47.2% and rising, identical in both timeframes. A week ago it was 32.05 and a month ago 29.61, so it has gained 15.19 points in a week and 17.64 in a month — positive and accelerating on both horizons. This is the strongest structural argument for the setup: the stock has spent nearly all of the past sixteen months above the zero line, and the September rebound pulled RS back toward the 50-60 area it reached in July and August. It is not new leadership; it is a long-running leader regaining its pace.
⑥ ATR & ADX

ATR is $5.47, or 4.7% of price — a stock that routinely moves several dollars a day. That puts the 1×ATR reference at $110.54 (−4.7%) and the 2×ATR reference at $105.07 (−9.4%); a structural stop has to sit that far away just to stay outside normal noise. ADX is 21.7, in the 20-25 "emerging trend" zone after bottoming in the high teens in mid-September. ADX measures strength, not direction, and a reading this low says the new upswing has not yet built into a strong trend.
⑦ OBV

OBV is in accumulation — above its 20-day average and rising — in both frames, 18.18% above the MA20 on the 90-day view and 8.92% on the 2-year view (these are spreads against the average, not divergence measures). The chart's divergence field is bullish in both frames: price fell from $109.68 on Aug 13 to $90.55 on Sep 14, while OBV rose from 3,859,100 to 4,303,700 on the 90-day scale, meaning volume kept favoring up days through the pullback. That is the constructive counterweight to the RSI divergence: momentum is fading on the oscillator, but net volume flow did not break down during the decline and has since pushed higher.
Bull Case vs Bear Case
Bull Case
- Highest close in the one-year window ($116.01), above the Aug 12 closing peak of $114.28.
- Full alignment in place: close > SMA5 $111.92 > SMA20 $98.35 > SMA60 $95.87, with SMA20 rising.
- Mansfield RS +47.2% vs the Nasdaq Composite, up 15.19 points in a week — positive and accelerating.
- MACD golden cross on Sep 17 from near zero, histogram widening to 2.410.
- OBV in accumulation in both frames with a bullish OBV divergence through the Aug-Sep pullback.
- Price above both anchored VWAPs ($102.79 90d, $90.44 2y) — recent buyers are in profit.
Bear Case
- The 20-day-high breakout is one session old — it formed on the base date itself.
- SMA20 crossed above SMA60 only on Sep 22; almost every condition formed within seven sessions.
- Breakout volume 0.96× average (about 1.18× market-adjusted) — ordinary, not emphatic.
- Bearish RSI divergence: higher close than Aug 12 on a lower RSI (73.75 → 68.09).
- Close sits on the upper Bollinger Band and $2.66 under the $118.67 52-week high.
- No catalyst identified for the +8.82% and +5.13% sessions; ATR 4.7% puts the 2×ATR stop 9.4% away.
Scenarios
| Scenario | Probability | Path | Trigger / Invalidation |
|---|---|---|---|
| Breakout extends | 35% | Price holds above $114.28 and pushes through the $118.67 52-week high as the young alignment matures. | Trigger: a close above $118.67 on volume clearly above the 227,170 average. Invalidation: a close back below $110.54. |
| Pullback that holds | 40% | The RSI divergence plays out as a pause; price retraces into the $110.00-$103.28 zone (23.6%-50% of the Sep 14-25 swing) and stabilizes above SMA20. | Trigger: a higher low above the 90d aVWAP $102.79. Invalidation: a close below $105.07 (2×ATR). |
| Breakout fails | 25% | The one-day breakout reverses, as the early-July and mid-August MACD peaks did, and price falls back toward the $95.31-$97.36 gap and SMA20/SMA60. | Trigger: a close below $105.07. Invalidation of this path: a close above $118.67. |
Key Levels
| Price | Role | Basis |
|---|---|---|
| $118.67 | Resistance | 52-week high |
| $116.01 | Current | Close of Sep 25, 2026 · upper Bollinger Band $116.03 · 0% of the Sep 14-25 up-swing |
| $114.28 | Support | Aug 12, 2026 closing peak — the level the breakout cleared |
| $110.00 | Support | 23.6% retracement of the $90.55 → $116.01 up-swing · near 1×ATR $110.54 |
| $105.07 | Stop | 2×ATR objective invalidation, −9.4% from the close · near 38.2% retracement $106.28 |
| $102.79 | Support | 90-day anchored VWAP (Aug 6 anchor) · near 50% retracement $103.28 |
| $97.36 | Support | Top of the Sep 17 unfilled gap ($95.31-$97.36) · SMA20 $98.35 · SMA60 $95.87 |
What to Watch
- Whether price can hold above the $114.28 August closing peak — a one-day breakout that slips back under it has not proven anything.
- Volume on any push toward $118.67: participation clearly above the 227,170 average would answer the weakest point of this setup.
- RSI: a failure to exceed the August reading of 73.75 on a further price high would deepen the bearish divergence.
- MACD histogram: a first contraction from 2.410 would be the earliest sign the Sep 17 cross is losing steam, as happened after the early-July and mid-August peaks.
- The SMA20-SMA60 spread ($2.48): a new alignment this narrow can unwind quickly if price falls back toward $98.
Conclusion
Past Analyses of This Stock same ticker · newest first
Other signals from this issue same publication date · 5 stocks
This analysis is an educational interpretation of chart data and is not investment advice. Probabilities and levels are subjective estimates; every investment decision, and its outcome, is your own responsibility. All figures are derived from closing-price data through September 25, 2026 and are not updated after publication.
Two Week Swing · twoweekswing.com · 4,600+ stocks screened weekly