IMAX Corporation
$56.05 −1.1% from the 52-week high of $56.68 · +82.3% from the 52-week low of $30.74
This analysis is based on closing-price data as of September 25, 2026. Whether you're researching how to buy IMAX Corporation stock or you've just opened a brokerage account and are trying to time an entry, here are objective support levels and stop-loss references built from the RSI, MACD and ATR indicators.
Over two years IMAX has climbed in a steady staircase from the low $20s to $56.05, and the latest leg took it from a July base near $38 to within 1.1% of its 52-week high. Mansfield relative strength of +30.8% against the S&P 500 is positive and rising, and the SMA5 > SMA20 > SMA60 stack has been in place since September 16. The short-term signal is young and should be read in context: the 20-day-high breakout and the MACD golden cross are both only two sessions old, and both formed on September 24 — the same day Morgan Stanley initiated coverage of the stock. Against that, the push to a new closing high comes with a bearish RSI divergence and a bearish OBV divergence on the 90-day frame, so this page treats the move as a trend continuation that still has to prove its participation.
Snapshot all figures from the chart JSON · as of September 25, 2026
| Close | $56.05 |
|---|---|
| 52-week high / low | $56.68 (−1.1%) / $30.74 (+82.3%) |
| SMA5 / SMA20 / SMA60 | $54.43 / $52.53 / $48.34 — close > SMA5 > SMA20 > SMA60, bullish alignment |
| Bollinger (20) | Upper $55.35 · Mid $52.53 · Lower $49.72 · width 10.72% — close above the upper band |
| aVWAP — 90d | $50.20 (anchor Jul 23, 2026) — price above |
| aVWAP — 2y | $42.52 (anchor Feb 26, 2026) — price above |
| RSI (14) | 66.2 — firm, below 70 · bearish divergence flagged (2y and 90d) |
| Mansfield RS | +30.8% vs the S&P 500 · outperform · slope rising · prior week 25.65 · prior month 25.24 |
| MACD (12,26,9) | MACD 1.178 · Signal 1.017 · Histogram +0.161 · golden cross Sep 24, 2026 (above zero) |
| ADX (14) | 24.6 — trend emerging (direction-neutral) |
| ATR (14) | $1.85 — 3.3% of price |
| OBV — 2y / 90d | Early accumulation, above MA20, slope flat in both frames · spread vs own MA20: 5.46% (2y) / 10.87% (90d) · OBV bearish divergence flagged on 90d; none on 2y |
| Volume | 1,048,800 shares — 1.13× the 20-day average of 926,880 (about 1.39× after adjusting for a quiet 0.815× market session) |
| Stop references | 1×ATR $54.20 (−3.3%) · 2×ATR $52.35 (−6.6%) |
① Price & Moving Averages
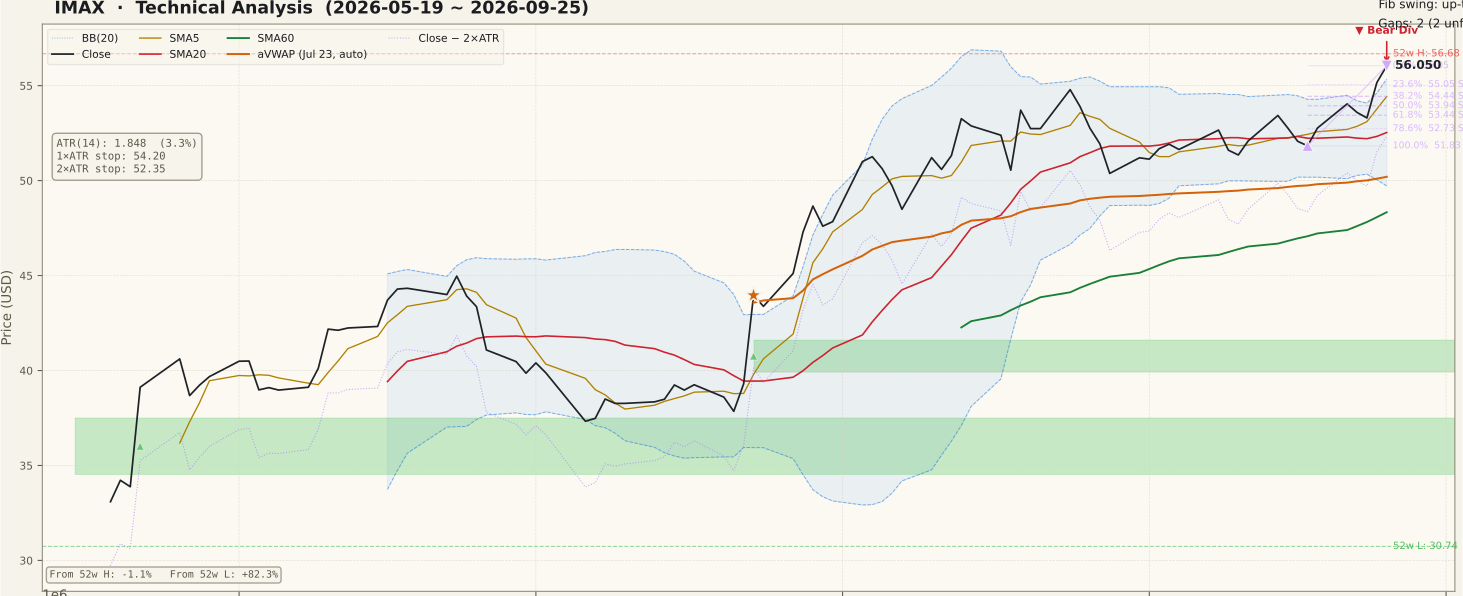
The two-year chart is a clean uptrend: higher lows since late 2024, a base between roughly $34 and $40 from March to July 2026, and then a sharp advance off the July 21 low of $37.85 that carried the stock above $51 by early August. From there it spent about six weeks going sideways between the high $40s and the mid $50s while SMA20 caught up. The moving averages are now fully stacked — close $56.05 above SMA5 $54.43, SMA20 $52.53 and SMA60 $48.34. That alignment has held since September 16, the close has been above SMA20 since September 18, and above SMA60 continuously since July 22 (47 sessions), so the trend itself did not start this week.
What is new is the breakout. The close cleared its 20-day high on September 24 and extended on September 25, finishing above the August 24 closing peak of $54.79. Those two sessions coincided with Morgan Stanley's initiation of coverage on September 24, so the breakout should not be read as independent of that event. The close now sits above the upper Bollinger Band ($55.35) with the bands at a moderate 10.72% width — a stretched position that often pauses. The 52-week high of $56.68 was printed intraday on September 25 itself, so the stock closed about 1.1% below its own session high. Both anchored VWAPs sit below price: $50.20 on the 90-day frame (July 23 anchor) and $42.52 on the two-year frame (February 26 anchor).
② Volume

Volume on the base date was 1,048,800 shares, 1.13× the 20-day average of 926,880. That is modest in raw terms, but September 25 was a quiet day across the market — the median stock in our universe traded at about 0.815× its own 20-day average — so relative to the tape IMAX's participation was closer to 1.39×. The September 24 initiation day ran at about 1.25× raw, which is also moderate.
One calendar effect matters here: September 18 (quadruple witching and the S&P quarterly rebalance, a session when the market median ran about 1.79×) sits inside the 20-day denominator and lifts the average somewhat. Even so, neither breakout session approaches the July 23 spike that launched the summer leg. The honest reading is that this breakout has adequate, not emphatic volume behind it — enough to avoid the "breakout on shrinking volume" trap, not enough to call it heavy accumulation.
③ MACD

MACD (1.178) crossed back above its signal line (1.017) on September 24, and the histogram has turned positive at +0.161. This is a re-cross well above zero, not an early-trend signal: MACD peaked near 3 in August, bled lower through most of September as price moved sideways, and has now turned back up without ever going negative. That is the typical shape of a trend resuming after a pause.
The caveat is the same one as on the price panel — the cross is two sessions old and formed on the analyst initiation day. The MACD line is also still far below its August peak, so momentum has improved but has not re-established the strength of the summer advance. A histogram that keeps widening over the next week would confirm; a quick fold back under the signal line would mark the cross as a one-event bounce.
④ RSI

RSI stands at 66.2 — firm momentum, but below the 70 overbought line. The chart flags a bearish RSI divergence in both frames: on August 24 the close was $54.79 with RSI at 68.1 (90-day; 67.9 on the two-year frame), while on September 25 the close was a higher $56.05 with RSI at a lower 66.2. Price made a higher high; momentum did not.
The gap between the two RSI peaks is small (about two points), and a divergence is a possibility of a turn, not a confirmation of one. In a strong trend RSI often lags for a while after a sideways pause. Still, it is a reason not to treat this breakout as a clean momentum thrust; a move through 70 on the next push would neutralise the divergence, while a roll-over below 50 would give it teeth.
⑤ Mansfield Relative Strength

Mansfield RS is +30.8% vs the S&P 500, tagged outperform with a rising slope, and it reads the same in both frames. Against the prior readings it is positive and accelerating: up 5.18 points from last week's 25.65 and up 5.59 points from last month's 25.24. The panel shows RS lifting sharply off the zero line in late July and holding in a 20–35 band since August.
This is the strongest structural argument on the page. The stock is not just rising with the market; it has been outperforming the index by a wide margin for two months, and the latest week widened that lead. Relative strength is what put IMAX in this week's breakout screen (RS rank 95), and it held through the September sideways phase rather than fading.
⑥ ATR & ADX

ATR is $1.85, or 3.3% of price, down from above $2.10 during the volatile August stretch. That puts the objective stop references at $54.20 (1×ATR, −3.3%) and $52.35 (2×ATR, −6.6%). The 2×ATR level sits just below SMA20 ($52.53), so the volatility-based and structure-based invalidation points roughly agree.
ADX is 24.6, in the 20–25 "trend emerging" zone. It declined through September as price consolidated and has only just begun to turn up. ADX measures strength, not direction, and at this level it says the new trend leg is forming rather than established — consistent with a breakout that is two sessions old.
⑦ OBV

OBV is tagged early accumulation in both frames — above its 20-day average (by 5.46% on the two-year frame and 10.87% on the 90-day frame) with a flat slope. The 90-day frame also flags a bearish OBV divergence: on August 24 OBV stood at 19,240,100 with the close at $54.79; on September 25 OBV was a lower 18,928,800 while the close was a higher $56.05. The two-year frame flags no OBV divergence.
Read together with RSI, the message is consistent: the new price high has not yet been matched by a new high in cumulative buying volume. The gap is small, and OBV staying above its average argues against active distribution. But "price at highs, OBV lagging" is exactly the non-confirmation that separates a durable breakout from one that fades back into the range, so it belongs on the watch list.
Bull vs Bear
Bull Case
- Full SMA5 > SMA20 > SMA60 alignment since September 16; close above SMA60 for 47 sessions.
- Mansfield RS +30.8% vs the S&P 500 and accelerating (+5.18 pts week over week).
- Close above the 20-day high and the August 24 closing peak of $54.79, within 1.1% of the 52-week high.
- MACD golden cross well above zero — a resumption shape, not a bottom-fishing signal.
- Price above both anchored VWAPs ($50.20 90d, $42.52 2y); OBV above its MA20 in both frames.
- Volume about 1.39× on a market-adjusted basis, on a quiet session for the broad tape.
Bear Case
- The breakout and MACD cross are two sessions old and both formed on the Morgan Stanley initiation day.
- Bearish RSI divergence (both frames): higher price, lower RSI vs August 24.
- Bearish OBV divergence on the 90-day frame: OBV 18.93M vs 19.24M at the August peak.
- Close above the upper Bollinger Band ($55.35) — stretched in the short term.
- Raw volume only 1.13× the average; no heavy accumulation on the breakout.
- ADX 24.6 is still only "emerging"; the September trend strength had faded.
Scenarios
| Scenario | Probability | Path | Trigger / Invalidation |
|---|---|---|---|
| Breakout holds and extends | 40% | Price clears the $56.68 52-week high and the divergences resolve as RSI and OBV make new highs. | Trigger: closes above $56.68 on volume above the 926,880 average, RSI through 70. Invalidation: close below SMA20 $52.53. |
| Pause and retest | 35% | The stretch above the upper band unwinds into the $53.94–$54.44 Fibonacci zone / SMA5 area before the trend resumes. | Holds above SMA20 $52.53 on the pullback; MACD stays above its signal. |
| Failed breakout | 25% | The initiation-day move fades, price slips back into the August–September range and the divergences play out. | Close below the 2×ATR stop $52.35; MACD folds back under its signal. |
Key Levels
| Price | Role | Basis |
|---|---|---|
| $56.68 | Resistance | 52-week high (intraday, Sep 25, 2026) |
| $56.05 | Current | Close of Sep 25, 2026 · 0% of the Sep 17 → Sep 25 up-swing |
| $54.44 | Support | 38.2% retracement of the $51.83 → $56.05 swing · SMA5 $54.43 |
| $53.94 | Support | 50% retracement of the same swing |
| $52.53 | Support | SMA20 / Bollinger mid-band |
| $52.35 | Stop (2×ATR) | Objective invalidation, −6.6% from the close |
| $50.20 | Support | 90-day anchored VWAP (Jul 23 anchor) |
Two unfilled support gaps sit well below: $39.92–$41.60 (July 23, 2026) and $34.53–$37.50 (May 22, 2026). Both are two-year context rather than levels relevant to the next two weeks.
What to Watch
- A close above $56.68. Clearing the 52-week high on above-average volume would be the first confirmation that does not rest on the initiation-day sessions.
- RSI and OBV making new highs with price. RSI through 70 and OBV above its August 24 level of 19,240,100 would erase both divergences.
- The MACD histogram at +0.161. Widening supports a trend resumption; a quick fold back under the signal line marks the cross as event-driven.
- SMA20 at $52.53 and the 2×ATR stop at $52.35. Any pullback that holds above this shelf keeps the structure intact; a close below it breaks it.
Conclusion
Past Analyses of This Stock same ticker · newest first
Other signals from this issue same publication date · 5 stocks
This analysis is an educational interpretation of chart data and is not investment advice. Probabilities and levels are subjective estimates; every investment decision, and its outcome, is your own responsibility. All figures are derived from closing-price data through September 25, 2026 and are not updated after publication.
Two Week Swing · twoweekswing.com · 4,600+ stocks screened weekly