Marex Group plc
$78.27 −0.14% from the 52-week high of $78.38
This analysis is based on closing-price data as of September 4, 2026. Whether you're researching how to buy Marex Group plc stock or you've just opened a brokerage account and are trying to time an entry, here are objective support levels and stop-loss references built from the RSI, MACD and ATR indicators.
MRX closes the week at $78.27, within $0.11 of its $78.38 52-week high and roughly 180% above the $27.91 low of the past year — a stock in the upper reaches of a two-year advance rather than one attempting a turn. What separates this chart from a one-session spike is sequence: the close > SMA5 > SMA20 > SMA60 stack has been intact for seventeen straight sessions since August 13, and the base that formed inside that alignment was resolved by two consecutive sessions of gains rather than a lone bar. The reservations are the ones that come with any chart at its high — RSI at 69.14 is a point below the overbought line, ADX at 20.92 has not confirmed trend strength, and the close sits $0.99 under an upper Bollinger band that is already 23.34% wide. The lens for the weeks ahead is whether a two-day breakout gets a third day.
Snapshot as of September 4, 2026 close
| Metric | Value | Read |
|---|---|---|
| Close | $78.27 | At the top of the 90-day and two-year range |
| 52-week high / low | $78.38 / $27.91 | −0.14% from high · +180.44% from low |
| SMA5 / SMA20 / SMA60 | $74.14 / $70.98 / $66.42 | Close > 5 > 20 > 60 — full bullish stack |
| Bollinger (20,2) | $79.26 / $70.98 / $62.69 | Close $0.99 under the upper band · width 23.34% |
| aVWAP — 90d | $72.39 | Anchor Aug 12, 2026 · price above |
| aVWAP — 2y | $45.65 | Anchor Aug 5, 2025 · price above |
| RSI(14) | 69.14 | Just under 70 · no divergence flagged |
| Mansfield RS vs Nasdaq Composite | +53.91% | Outperform · week +8.36 · month +29.84 |
| MACD / Signal / Hist | 2.561 / 2.140 / 0.421 | Golden cross Aug 12, well above zero |
| ADX(14) | 20.92 | Emerging — under the 25 strong-trend line |
| ATR(14) | $3.35 (4.28% of price) | Moderate volatility |
| OBV — 2y / 90d | +29.90% / +39.04% vs MA20 | Early accumulation both frames · slope flat |
| Volume | 1,539,400 vs 762,460 avg | 2.02× the 20-day average |
| 1× / 2× ATR stop | $74.92 / $71.57 | −4.28% / −8.56% from close |
① Price & Moving Averages
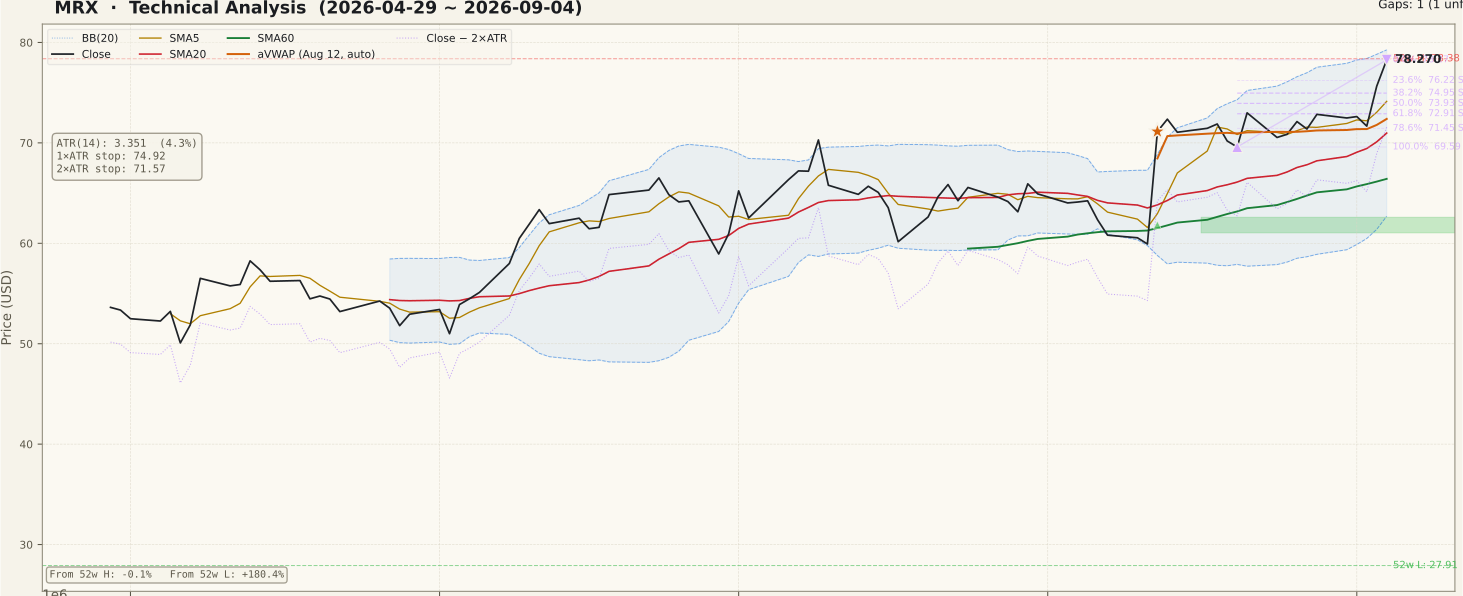
The moving-average sequence is complete and correctly ordered: the $78.27 close sits above SMA5 $74.14, which sits above SMA20 $70.98, which sits above SMA60 $66.42, and the 90-day panel shows all three rising together. Price is 17.8% clear of SMA60, which is the profile of a trend already in motion rather than one just forming. That distance is the first honest caution — a stock this far from its intermediate average has, by construction, further to fall before it finds that average again.
The structure behind the current level matters more than the level itself. The 90-day Fibonacci grid is drawn from the August 20 low of $69.59 up to the September 4 anchor high of $78.27, so the swing being measured is only two weeks old; the retracement shelves it produces sit at $76.22 (23.6%), $74.95 (38.2%), $73.93 (50%) and $72.91 (61.8%). Above the market there are two references and they are close together: the $78.38 52-week high and the $79.26 upper Bollinger band. Below, the single unfilled gap on the chart is a support gap at $61.03–$62.60 dated August 12 — the session that also anchors the 90-day VWAP at $72.39 and dates the MACD golden cross. That August 12 gap followed the company's second-quarter results and sits sixteen sessions before this basis date, well outside the recent window, but it remains the structural origin of the entire advance being read here.
② Volume

The closing session traded 1,539,400 shares against a 20-day average of 762,460 — 2.02× normal. That is the second consecutive expansion: the September 3 session also ran well above its average as price took out the 20-day high, and September 4 extended it. Two high-volume sessions in a row is materially better evidence than one, because it is the difference between a single repricing print and participation that persisted into the next day.
The three sessions before that pair were unremarkable — volume within roughly 0.9× to 1.2× of average on small moves — so the expansion is genuinely tied to the breakout rather than a standing condition. The caution is that a 20-day average of 762,460 shares is a modest base, which means single institutional prints move the ratio easily; the useful test is not the size of the spike but whether average volume itself steps up over the following weeks. A move to new highs on sub-average volume would be the textbook unconfirmed breakout, and this chart has not yet had the chance to fail that test.
③ MACD

MACD reads 2.561 against a signal line of 2.140, leaving the histogram positive at 0.421. The last cross was a golden cross on August 12 — the same date as the gap — and it occurred far above the zero line rather than beneath it. That distinction matters: a cross deep below zero marks an early recovery from a downtrend, while a cross this far above zero marks the re-acceleration of a trend already established.
The histogram at 0.421 is the more useful number going forward. It is comfortably positive rather than marginal, so the two lines are separating rather than converging, and separation is what validates a cross after the fact. If the histogram narrows toward zero while price holds its highs, that would be momentum fading beneath a flat price — the standard early warning that a breakout is running out of the force that produced it.
④ RSI

RSI(14) finishes at 69.14, one point short of the conventional 70 overbought line
and effectively identical on the two-year frame at 69.14. No divergence is flagged in the sidecar —
both rsi.divergence and its peak fields are null — so there is no evidence here of price
making a higher high while momentum makes a lower one. The absence of a divergence is a real
positive, but it is the absence of a warning, not the presence of a signal.
A reading in the high 60s at a 52-week high is normal rather than alarming; strong trends routinely spend weeks between 60 and 80. The practical point is that there is very little room left before the indicator itself starts arguing the move is stretched, and readings above 70 make the chart more sensitive to ordinary consolidation. Beginners often treat 70 as an exit line — it is more usefully read as a note that any pullback from here starts from an extended position rather than a neutral one.
⑤ Mansfield Relative Strength

Mansfield RS is +53.91% against the Nasdaq Composite, the correct benchmark for a Nasdaq listing, and the reading is identical on the 90-day and two-year panels because the measure is anchor-free. The value is well above the zero line, so this stock has been outperforming its index by a wide margin, and the slope is rising.
The rate of change is the stronger part of the picture. One week ago RS stood at 45.55 and one month ago at 24.07, so the weekly change is +8.36 and the monthly change +29.84 — positive readings getting more positive, which is the accelerating quadrant rather than merely the positive one. Relative strength of this order is the single most supportive element in the chart, and it is worth naming what it is not: RS measures performance against an index, not the durability of the move that produced it.
⑥ ATR & ADX

ATR(14) is $3.35, or 4.28% of price — moderate for a stock that has tripled from its 52-week low, and it sets the scale of any objective risk framing. A 1× ATR reference sits at $74.92 and a 2× ATR reference at $71.57, which is 8.56% below the close. That places the wider stop just above SMA20 at $70.98 and just above the $69.59 low that anchors the current Fibonacci swing, so the level is structurally coherent rather than arbitrary.
ADX(14) is 20.92 and tagged "emerging" — above the 20 line that separates range from developing trend, but below the 25 line that marks a strong one. This is the clearest non-confirmation in the chart: price is at a 52-week high while the trend-strength gauge says the directional move has not yet reached the threshold that usually accompanies one. ADX measures strength and not direction, so a rise through 25 from here would confirm the move rather than warn about it; a fade back under 20 would say the breakout was a range expansion that did not become a trend.
⑦ OBV

On-balance volume is tagged early accumulation on both timeframes and sits above its 20-day average in each: 10,861,700 against 7,811,780 on the 90-day frame (+39.04% above the average) and 13,249,700 against 10,199,780 on the two-year frame (+29.90%). The two frames agree, which is not always the case and is worth noting when they do.
The qualification is the slope, which is tagged flat on both frames. Volume flow is
comfortably above its own average but is not currently expanding, so the reading describes
accumulation that has already happened rather than accumulation that is still building. No OBV
divergence is flagged — the obv.divergence field is null on both frames — so there is no
bearish non-confirmation at the high, but a flat slope alongside a price breakout is the specific
thing to watch: if price extends while OBV stays level, that gap becomes the non-confirmation that is
currently absent.
Bull Case vs Bear Case
Bull Case
- Close of $78.27 is just 0.14% under the $78.38 52-week high, at the top of the two-year range.
- Full bullish stack — close > SMA5 $74.14 > SMA20 $70.98 > SMA60 $66.42 — intact for 17 consecutive sessions since Aug 13.
- Mansfield RS +53.91% vs the Nasdaq Composite, positive and accelerating (+8.36 week, +29.84 month).
- MACD 2.561 over signal 2.140 with a 0.421 histogram; the Aug 12 golden cross printed well above zero.
- OBV above its MA20 on both frames (+39.04% 90d, +29.90% 2y) with no bearish divergence flagged in either oscillator.
- Price trades above both anchored VWAPs — $72.39 (Aug 12) and $45.65 (Aug 5, 2025) — so buyers on both horizons are onside.
Bear Case
- ADX 20.92 is "emerging", below the 25 strong-trend line — trend strength has not confirmed the price high.
- RSI 69.14 is one point under 70; there is almost no headroom before the reading itself flags an extended tape.
- Close is $0.99 under the $79.26 upper Bollinger band with width already 23.34% — pressed against its own volatility envelope.
- The breakout leg is two sessions wide; the three sessions before it netted lower on ordinary volume.
- OBV slope is flat on both frames — flow is above average but no longer expanding into the high.
- ATR is 4.28% of price; the objective 2× ATR stop at $71.57 is 8.56% away and sits below the entire current swing.
Scenarios
| Scenario | Probability | Path | Trigger / Invalidation |
|---|---|---|---|
| Breakout extends | 40% | Price holds the $76.22 23.6% shelf, clears the $78.38 52-week high and the $79.26 upper band on volume at or above the 762,460 average, and moves into territory with no overhead reference from the past two years while ADX turns up through 25. | Trigger: daily close above $79.26 with volume ≥ average. Invalidation: close back below $74.14. |
| Base retest | 40% | The two-session advance is partly given back into the $74.95–$72.91 Fibonacci band, where SMA5 $74.14 and the $72.39 aVWAP sit, while the moving-average stack and positive relative strength stay intact. | Trigger: two consecutive closes below $74.14. Invalidation: close above $78.38. |
| Alignment breaks | 20% | Price loses the $72.39 aVWAP and the $69.59 swing low, the 17-session moving-average stack unwinds as SMA20 $70.98 gives way, and the unfilled Aug 12 gap at $62.60–$61.03 becomes the next structural reference. | Trigger: close below $71.57. Invalidation: reclaim of $74.14 with volume ≥ average. |
Key Levels
| Price | Role | Basis |
|---|---|---|
| $79.26 | Resistance | Upper Bollinger Band (20,2) — width 23.34% |
| $78.38 | Resistance | 52-week high — touched intraday on Sep 4 |
| $78.27 | Current | Close, Sep 4, 2026 — also the Fibonacci 0% anchor high |
| $76.22 | Support | Fibonacci 23.6% of the Aug 20 → Sep 4 swing — first shelf under the breakout |
| $74.14 | Support | SMA5, with the 38.2% Fibonacci at $74.95 immediately above |
| $72.39 | Support | aVWAP anchored Aug 12, 2026 — the 61.8% Fibonacci at $72.91 sits just above |
| $71.57 | 2× ATR stop | Objective invalidation — 8.56% below the close, above SMA20 $70.98 |
What to Watch
- Whether $76.22 holds. The 23.6% retracement of the Aug 20 → Sep 4 swing is the first shelf beneath a two-day advance; holding it keeps the breakout structure intact, losing it puts the whole leg in play.
- Volume on any push through $78.38. Follow-through needs sessions at or above the 762,460 20-day average — and more usefully, an average that steps up rather than a single spike that decays.
- ADX crossing 25. At 20.92 the trend-strength gauge has not confirmed the price high; a turn up through 25 would, while a fade back under 20 would mark the move as range expansion.
- The OBV slope. It is flat on both frames while price is at highs. A slope that turns up alongside price confirms flow; price extending while OBV stays level would create the bearish non-confirmation that is currently absent.
- RSI relative to 70. At 69.14 the indicator is at the line. Sustained readings above it are normal in strong trends but mark an extended starting point for any pullback; a rollover back under 50 would say momentum has left the move.
Conclusion
Past Analyses of This Stock same ticker · newest first
Other signals from this issue same publication date · 4 stocks
This analysis is an educational interpretation of chart data and is not investment advice. Probabilities and levels are subjective estimates; every investment decision, and its outcome, is your own responsibility. Chart readings describe structure that has already formed and carry no claim about future price.
Two Week Swing · twoweekswing.com · 4,600+ stocks screened weekly