Appian Corporation
$38.37 −16.7% from the 52-week high ($46.06)
This analysis is based on closing-price data as of September 4, 2026. Whether you're researching how to buy Appian Corporation stock or you've just opened a brokerage account and are trying to time an entry, here are objective support levels and stop-loss references built from the RSI, MACD and ATR indicators.
The two-year chart holds two very different stories: a November 2025 spike to the $46.06 52-week high that unwound over the following five months into an $18.63 low, and then a second advance out of that low which has carried price back to $38.37 — up 106.0% from the low and still 16.7% under the old high. The second leg is the better-built one: Mansfield RS has crossed from deeply negative territory to +18.53% against the Nasdaq Composite, ADX at 42.1 sits well past the 25 strong-trend threshold, and the SMA5 > SMA20 > SMA60 stack has been intact since late July. What the last few sessions added is the first real pause in that leg: price came off the $42.95 August 31 high, gave up SMA5, and printed a MACD dead cross on September 2 — all of it still well above the rising longer averages. This page separates the trend, which is intact, from the pullback, which is not yet resolved.
Snapshot values as of the September 4, 2026 close
| Metric | Value | Read |
|---|---|---|
| Close | $38.37 | Below SMA5, fractionally above SMA20, far above SMA60 |
| 52-week high / low | $46.06 / $18.63 | −16.7% from the high, +106.0% off the low |
| SMA5 / SMA20 / SMA60 | $40.48 / $38.32 / $29.31 | Stack still ordered and rising; price has slipped under the 5-day line only |
| Bollinger (20) upper / mid / lower | $43.31 / $38.32 / $33.32 | Band width 26.08% — wide, the signature of the August expansion |
| aVWAP — 2y anchor (Nov 6, 2025) | $28.48 | Price sits 25.8% above the long-term anchor |
| aVWAP — 90d anchor (Jun 1, 2026) | $28.38 | Short-term buyers are 26.0% in profit — no trapped cohort near price |
| RSI(14) | 56.5 (90d) · 56.5 (2y) | Back to mid-range from an overbought stretch; no divergence flagged on either frame |
| Mansfield RS vs the Nasdaq Composite | +18.53% | Outperform; prior week +32.09%, prior month +6.81% — up over the month, down over the week |
| MACD / signal / histogram | 2.869 / 3.231 / −0.362 | Dead cross on September 2, 2026 — but both lines are far above zero |
| ADX(14) | 42.1 (90d) · 41.8 (2y) | Well past the 25 strong-trend threshold; strength, not direction |
| ATR(14) | $2.104 (5.48% of price) | A wide daily range — one normal session covers most of the near shelf |
| OBV state | 2y: early accumulation (+3.01% vs MA20) · 90d: accumulation (+6.26%) | Above its MA20 on both frames; rising on 90d, flat on 2y |
| Volume (last / 20-day avg) | 1,087,400 / 772,380 — 1.41× | The pullback's last session traded above average, not on thin trade |
| 1× / 2× ATR stop reference | $36.27 / $34.16 | −5.48% / −10.96% from the close |
① Price & Moving Averages
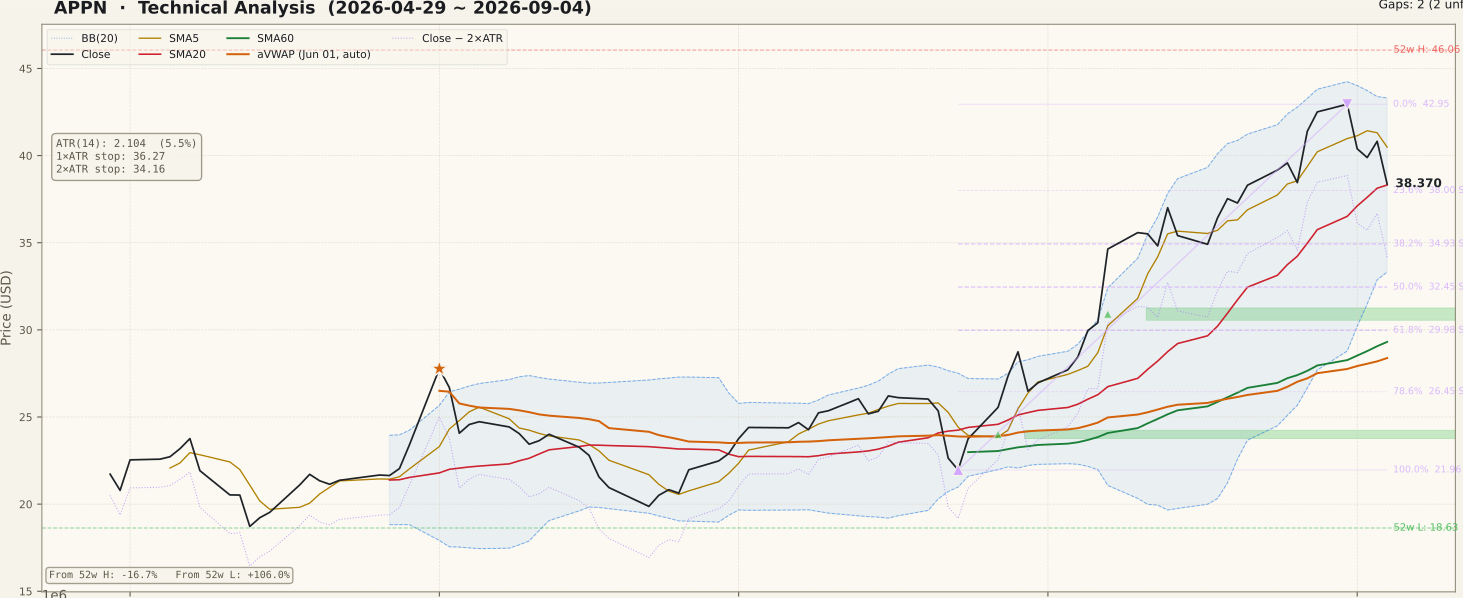
The moving-average stack is still in bullish order — SMA5 $40.48 above SMA20 $38.32 above SMA60 $29.31, all three rising — and the close of $38.37 has broken only the first of them. Price sits 5.5% under SMA5 and 0.14% over SMA20, which is as shallow as a first pullback gets while still being a pullback. Because the Bollinger mid-band is the same calculation as SMA20, $38.32 carries double weight as the line that defines whether this stays a pause or becomes a retracement; the upper band at $43.31 sits just above the $42.95 swing high and marks the top of the August expansion, and band width at 26.08% shows how far the bands opened during that run.
Both anchored VWAPs are far beneath the market — $28.48 from the November 6, 2025 anchor on the two-year chart and $28.38 from the June 1, 2026 anchor on the 90-day chart — so the average buyer from either anchor is roughly 26% in profit and under no pressure to sell into weakness. Retracement levels measured across the summer swing (low $21.96 on July 23 to high $42.95 on August 31) put the 0% line at $42.95 overhead and the 23.6% line at $38.00 as the first retracement shelf, immediately under the $38.32 SMA20 — a two-line zone within 1% of the close. Below that the 38.2% level at $34.93 sits just above the $33.32 lower band, and two unfilled support gaps remain far lower, at $30.55–$31.26 from August 7 and $23.76–$24.24 from July 27; neither is near enough to act as a magnet here.
② Volume

The most recent session traded 1,087,400 shares against a 772,380 twenty-day average — 1.41× — and it was a down session, which is the least flattering combination available on this panel. That said, 1.41× is a long way from the volume spikes the chart marks in late May and early June, and it is not the kind of reading that turns a pullback into a distribution event on its own. The August advance itself was carried on visibly elevated trade, so the participation behind the trend has been real rather than a drift on thin volume.
The useful test from here is directional confirmation. If price reclaims $40.48 on trade above the 772,380 average, the pullback reads as a shakeout; if the next leg down comes on trade heavier than this one, the two-year OBV tag of early accumulation is the first thing that would change. Note also that the 20-day average itself has been dragged up by the August run, so the bar for what counts as "heavy" is higher now than it was in July.
③ MACD

MACD is at 2.869 against a 3.231 signal line, and the histogram has turned negative at −0.362 following a dead cross dated September 2, 2026. The detail that matters is where the cross happened: both lines are far above the zero line, and on the two-year panel this is the highest the pair has traded all year. A dead cross this far above zero describes a decelerating advance, not a completed reversal — the cross that would carry real weight is a subsequent move of both lines back through zero.
Momentum is nonetheless narrowing. The histogram had already been shrinking through late August while price was still making highs, which is the ordinary way a strong leg ends its acceleration phase. Watch whether the histogram turns back positive with both lines still elevated, or whether MACD keeps rolling toward the signal line's own peak; those are materially different outcomes from the same starting point.
④ RSI

RSI(14) reads 56.5 on the 90-day frame and 56.5 on the two-year frame — effectively identical, and comfortably in the neutral band between the 30 and 70 lines. The shape behind that number is the informative part: the 90-day panel shows RSI holding above 70 for an extended stretch through late August, which is what an oscillator does during a genuine trend rather than a warning by itself, and the drop to 56.5 has happened quickly.
Neither timeframe reports a divergence — rsi.divergence is null on both — so there is no lower-high
momentum signal underneath the August high, and none should be read into the panel's shape. A hold above 50 during
this pullback would keep the trend structure intact on this indicator; a break below 50 for the first time since
July would be the first genuine momentum failure of the advance.
⑤ Mansfield Relative Strength

Mansfield RS stands at +18.53% versus the Nasdaq Composite, in outperform territory. Because the reading is anchor-free, the 90-day and two-year panels carry the same value, and the two-year panel gives it context: the line spent almost all of 2025 and the first half of 2026 below zero and only crossed above it in August 2026. This is a recent leadership change, not a long-standing one.
The two rates of change point opposite ways. Against a prior month of +6.81% the reading is up 11.72 points — positive and accelerating on the monthly view. Against a prior week of +32.09% it is down 13.56 points — positive but slowing on the weekly view, and that weekly give-back is the largest on the visible panel. Both readings are true at once: the stock has gained a lot of ground on the index over a month and handed a meaningful slice of it back in the last week. The level that matters is zero, and +18.53% is still a wide buffer above it.
⑥ ATR & ADX

ADX(14) at 42.1 on the 90-day frame and 41.8 on the two-year frame is far past the 25 strong-trend threshold, and the two panels agree on it. ADX measures strength, not direction, so it confirms the August advance was a real trend rather than a drift — and it would say the same about a decline of equal conviction. It is currently the strongest single argument that this is a pause inside a trend.
ATR(14) at $2.104 is 5.48% of the $38.37 close, roughly double the levels the panel shows in June and July. That changes what the price levels mean in practice: the $38.32 SMA20 and the $38.00 retracement shelf sit less than a quarter of one ATR below the close, so a single ordinary session can move through both without anything structural having happened. Position sizing has to be built from this number, and the 1× and 2× ATR references at $36.27 and $34.16 are the objective expressions of it.
⑦ OBV

The two timeframes are tagged differently and both are constructive. The 90-day frame reads accumulation, above its MA20 by 6.26% with a rising slope; the two-year frame reads early accumulation, above its MA20 by 3.01% but flat. The gap is a timing artifact — the 90-day window contains only the August advance, while the two-year window still carries the long distribution phase that followed the November 2025 spike, so the longer measure is slower to turn.
Neither frame flags an OBV divergence; obv.divergence is null on both, so there is no lagging-volume
signal behind the August high to report. One caution on reading the percentages: divergence_pct here is
the spread between OBV and its own MA20 — a measure of accumulation intensity — and not a divergence reading. The
honest summary is that volume flow has not deteriorated during the pullback, which is the single most encouraging
thing on the page for the bull case.
Bull Case
- Mansfield RS +18.53% versus the Nasdaq Composite, up 11.72 points over the month from +6.81%.
- The full stack is intact and rising — SMA5 $40.48 > SMA20 $38.32 > SMA60 $29.31 — with price still above the 20-day line.
- ADX 42.1 — well past the 25 strong-trend threshold on both frames; the advance was a trend, not a drift.
- 90-day OBV is tagged accumulation, 6.26% above its MA20 and rising — volume flow did not deteriorate during the pullback.
- Both anchored VWAPs sit roughly 26% below price ($28.48 2y, $28.38 90d) — no cohort of buyers is trapped near current levels.
- The MACD dead cross occurred with both lines far above zero at 2.869 and 3.231 — deceleration, not reversal.
Bear Case
- The close of $38.37 is 5.5% below SMA5 $40.48 and 10.7% below the $42.95 August 31 swing high.
- MACD dead cross dated September 2, 2026, with the histogram already negative at −0.362.
- Mansfield RS is down 13.56 points week over week from +32.09% — the sharpest weekly give-back on the panel.
- ATR at 5.48% of price means one ordinary session covers the whole $38.32–$38.00 shelf; the support is thin relative to the noise.
- The last session's 1.41× volume landed on a down day, so the heaviest recent trade is on the wrong side.
- Two-year OBV is only 3.01% above its MA20 and flat, and the $46.06 52-week high from November 2025 remains 16.7% overhead.
Scenarios
| Scenario | Probability | Path | Trigger / Invalidation |
|---|---|---|---|
| Shallow pause, then continuation | 45% | Price holds the $38.32–$38.00 shelf, works off the August extension sideways, then reclaims SMA5 $40.48 and revisits the $42.95 swing high with the $43.31 upper band just above it. | Trigger: a close back above $40.48 on volume above the 772,380 twenty-day average. Invalidated on a close below $38.00. |
| Deeper retracement into the 38.2% zone | 35% | SMA20 gives way and price works down toward $34.93, where the 38.2% retracement sits just above the $33.32 lower Bollinger band — the ordinary depth for a first correction after a run of this size. | Trigger: a close below $38.00. This path resolves bullishly if the $34.93–$33.32 zone holds and price reclaims $38.32; it fails on a close below $34.16. |
| Trend break | 20% | The 2× ATR reference and the lower band both give way, opening the 50% retracement at $32.45, the 61.8% level at $29.98 and the August 7 support gap at $30.55–$31.26, with rising SMA60 $29.31 inside that band. | Trigger: a close below $34.16, ideally confirmed by Mansfield RS breaking the rising sequence it has held since the August zero-line cross. Invalidated by a reclaim of $38.32. |
Key Levels
| Level | Role | Basis |
|---|---|---|
| $43.31 | Resistance | Bollinger upper band — the ceiling of the August expansion, band width 26.08% |
| $42.95 | Resistance | 0% of the summer swing (August 31, 2026 high) — the anchor the fibonacci grid is measured from |
| $40.48 | Resistance | SMA5 — the first line price must reclaim to end the short-term stall |
| $38.37 | Current close | September 4, 2026 close |
| $38.32 | Support / pivot | SMA20 and the Bollinger mid-band at the same value — price closed just above it |
| $38.00 | Support | 23.6% retracement of the July 23 – August 31 swing; forms a two-line shelf with SMA20 |
| $34.16 | 2× ATR stop reference | Objective invalidation — 2× the $2.104 ATR below the close, −10.96%; sits just under the $34.93 38.2% retracement |
What to Watch
- $38.32, then $38.00. SMA20 doubles as the Bollinger mid-band, and the 23.6% retracement sits immediately beneath it. The two are less than a quarter of one ATR apart, so treat them as a single shelf rather than two separate tests.
- Whether volume follows direction. The last session was 1.41× average on a down day. A reclaim of $40.48 on below-average trade would be exactly the unconfirmed breakout that traps buyers; heavier trade on further downside would be the first thing to change the OBV picture.
- The MACD pair, not the cross. The September 2 cross happened at 2.869 / 3.231, far above zero. The signal that would carry real weight is both lines working back down through the zero line, which has not started.
- Mansfield RS deceleration. The weekly change is already −13.56 points. The question is whether the line flattens well above zero, as it has done since the August cross, or keeps compressing toward the zero line that defines leadership.
- RSI at 50. The reading fell from an overbought stretch to 56.5 in a handful of sessions. Holding above 50 keeps the momentum structure intact; the first break below it since July would not.
Conclusion
Past Analyses of This Stock same ticker · newest first
Other signals from this issue same publication date · 4 stocks
This analysis is an educational interpretation of chart data and is not investment advice. Probabilities and levels are subjective estimates; every investment decision, and its outcome, is your own responsibility. Chart indicators describe what price has already done — they cannot account for company news, earnings or regulatory events that have not yet occurred.
Two Week Swing · twoweekswing.com · 4,600+ stocks screened weekly