Arvinas, Inc.
$9.39 −35.3% from the 52-week high ($14.51)
This analysis is based on closing-price data as of September 4, 2026. Whether you're researching how to buy Arvinas, Inc. stock or you've just opened a brokerage account and are trying to time an entry, here are objective support levels and stop-loss references built from the RSI, MACD and ATR indicators.
The two-year chart is a damaged name in the middle of a slow repair: a slide out of the high $20s, an unfilled gap down through $17.22–$10.78 in March 2025, a long base around the $6.97 52-week low, one recovery to the $14.51 52-week high last winter, and a second slide back toward $8 this summer. What changed in August is structural rather than dramatic — the July 31 low at $8.03 held, SMA60 at $8.51 turned up underneath, and the $9.39 close now sits above all three moving averages in the correct order. The near-term question is narrower: price has eased back from the August 19 swing high of $9.68 on volume running at 0.77× the 20-day average, with a MACD dead cross dated August 28 and a regular bearish RSI divergence flagged on both timeframes. This page weighs a shallow, orderly pullback inside a young uptrend against a stock still 35.3% under its 52-week high and still 17.64 points behind the Nasdaq Composite on Mansfield RS.
Snapshot values as of the September 4, 2026 close
| Metric | Value | Read |
|---|---|---|
| Close | $9.39 | Above SMA5, SMA20 and SMA60 — a complete bullish stack |
| 52-week high / low | $14.51 / $6.97 | −35.3% from the high, +34.7% off the low |
| SMA5 / SMA20 / SMA60 | $9.35 / $9.24 / $8.51 | Close > 5 > 20 > 60 in order, with the 60-day line rising underneath |
| Bollinger (20) upper / mid / lower | $9.69 / $9.24 / $8.79 | Band width 9.66% — a narrow band; price sits in the upper half |
| aVWAP — 2y anchor (Mar 11, 2025) | $8.88 | Price is 5.7% above the long-term anchor |
| aVWAP — 90d anchor (Aug 4, 2026) | $9.01 | August buyers are in profit, but only just — the anchor is close beneath |
| RSI(14) | 56.6 (90d) · 56.6 (2y) | Mid-range, well short of 70; regular bearish divergence flagged on both frames |
| Mansfield RS vs the Nasdaq Composite | −17.64% | Underperform, slope rising (prior week −19.18%, prior month −23.60%) |
| MACD / signal / histogram | 0.213 / 0.235 / −0.022 | Dead cross on August 28, 2026 — but the whole structure is above zero |
| ADX(14) | 24.7 (90d) · 24.2 (2y) | Emerging trend, just under the 25 line — strength building, not established |
| ATR(14) | $0.358 (3.81% of price) | A wide daily range for a single-digit stock — size positions off this, not off the price |
| OBV state | 2y: early accumulation (+3.99% vs MA20) · 90d: early accumulation (+35.4%) | Above its MA20 on both frames, but the slope is flat on both |
| Volume (last / 20-day avg) | 449,300 / 584,770 — 0.77× | The pullback is happening on quiet trade, not on selling pressure |
| 1× / 2× ATR stop reference | $9.03 / $8.67 | 2× ATR sits −7.63% below the close, just under the 61.8% retracement |
① Price & Moving Averages
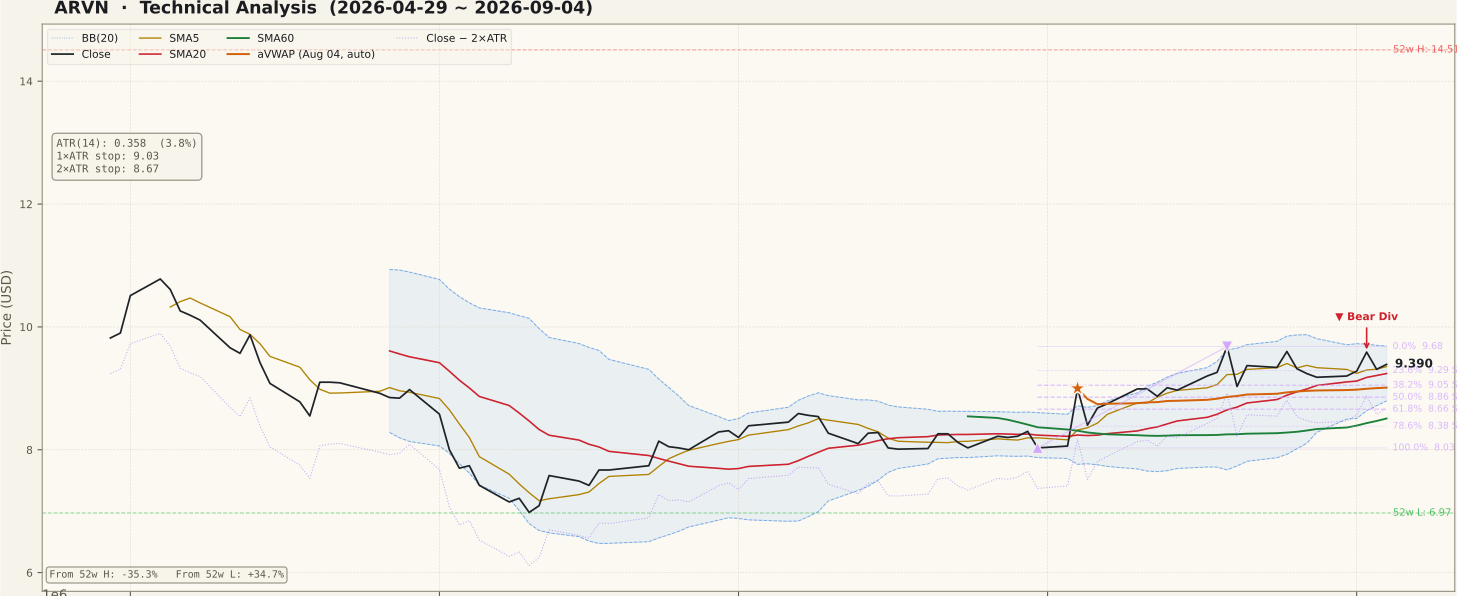
This is the cleanest part of the case. The close of $9.39 sits above SMA5 $9.35, which sits above SMA20 $9.24, which sits above SMA60 $8.51 — a full bullish alignment, and one the 90-day panel shows was assembled in the first week of August rather than in the last few sessions. The 60-day line has turned up from the summer base and is now the widest-spaced of the three, which is what a young trend looks like when the short averages lead and the slow one follows. Because the Bollinger mid-band is the same calculation as SMA20, $9.24 carries double weight as the first line that must hold; band width at 9.66% is narrow, so the bands are coiled rather than stretched.
The retracement grid is measured across the summer swing — the July 31 low at $8.03 up to the August 19 high at $9.68 — so the levels read as pullback support. Price has held above the shallowest of them, the 23.6% line at $9.29, which is why this is a drift rather than a breakdown; the 38.2% level at $9.05 sits almost on top of the 90-day anchored VWAP at $9.01 (anchored August 4) and the $9.03 one-ATR reference, stacking three independent lines into a single band. The long-term anchored VWAP from March 11, 2025 is far lower at $8.88, so buyers from either horizon are in profit. The 90-day frame carries no unfilled gaps at all; the two-year frame carries one, the resistance zone from $10.78 to $17.22 left behind on March 11, 2025, which is the ceiling this stock has not been back to in eighteen months.
② Volume

Friday traded 449,300 shares against a 20-day average of 584,770 — 0.77× normal. Quiet trade cuts both ways and it is worth being honest about which way here. In favour of the setup: the give-back from $9.68 has not attracted sellers, and nothing about the last stretch of bars looks like distribution. Against it: the advance that built this alignment was not confirmed by expanding participation either, and a trend that nobody is trading is a trend that can reverse cheaply.
The 90-day panel puts the real activity in early August, where a short cluster of 2×-plus spike bars marks the turn off the $8.03 low; since then both the bars and their 20-day average have shrunk steadily. The practical consequence is the one every beginner learns the hard way: if price returns to $9.68 on volume still under 1.0×, that is an unconfirmed breakout, and unconfirmed breakouts in low-priced biotech names fail more often than they hold. Volume expanding before the level, not after it, is the tell worth waiting for.
③ MACD

MACD is at 0.213 against a signal line of 0.235, leaving the histogram slightly negative at −0.022 after a dead cross dated August 28, 2026. Two qualifiers matter. First, the cross happened above the zero line, with both lines still positive — that is the signature of a pause inside an advance rather than a trend reversal, which would normally require the pair to roll through zero. Second, the histogram is shallow; the 90-day panel shows the bars fading toward the line rather than driving hard negative.
The setup is therefore genuinely two-sided at this indicator. A histogram that turns back positive while both lines stay above zero would re-arm the trend and would coincide with price reclaiming the $9.35–$9.68 area. A histogram that keeps deepening and drags the pair through zero would say the August advance is over regardless of where the moving averages sit, since the averages lag and MACD does not.
④ RSI

RSI(14) reads 56.6 on the 90-day frame and 56.6 on the two-year frame — mid-range, comfortably clear of the 30 oversold band and nowhere near the 70 overbought band. That is a neutral reading on its own, and it is the reason this pullback has room to resolve in either direction without an extreme unwinding first.
Both frames flag a regular bearish divergence, and the peaks are specific: on the 90-day frame, price made a higher high from $8.30 on July 30 to $9.59 on September 2 while RSI made a lower high from 66.60 to 61.55; the two-year frame prints the same dates with readings of 66.27 and 61.50. The honest reading is that momentum has thinned as price advanced — the second push required less energy than the first. The equally honest caveat is that a divergence is a possibility of a turn, not a confirmation of one, and this one is unresolved: price has not yet broken a level that would validate it, and a drive back above the 61.55 reading behind the September 2 high would erase it outright.
⑤ Mansfield Relative Strength

ARVN is a Nasdaq listing, so relative strength is measured against the Nasdaq Composite. The reading is −17.64% — still firmly below zero, still underperforming, and that is the single most important qualifier on everything else on this page. A stock can hold a textbook moving-average stack and still be the wrong place to have money if the index is compounding faster.
The direction, though, is clearly improving. The prior-week value was −19.18% and the prior-month value was −23.60%, so the line has climbed 1.55 points over the week and 5.97 points over the month — the negative-but-improving quadrant, where the gap to the index is closing rather than widening. Note the wording carefully: in negative territory an upward move is improvement, not acceleration, and the line is still roughly 17.6 points of ground away from parity. The two-year panel shows why that matters — this measure was above zero as recently as this past winter, so there is precedent for the recovery continuing, and equally there is precedent for it stalling in the −20s as it did through most of 2025.
⑥ ATR & ADX

ATR(14) is $0.358, or 3.81% of the price. On a $9.39 stock that is a wide daily envelope: a perfectly ordinary two-day drift can cover 7–8% without saying anything at all about the trend. This is the number that should drive position size, and it is why the objective invalidation on this page sits as far away as it does — a stop placed inside one ATR of the close would be triggered by noise rather than by evidence.
ADX(14) reads 24.7 on the 90-day frame and 24.2 on the two-year frame, tagged as an emerging trend — just beneath the 25 threshold that conventionally separates a trending market from a ranging one. ADX measures strength, not direction, so this does not vote bullish or bearish; what it says is that the August move has built some genuine directional persistence out of the summer chop but has not yet crossed into an established trend. Watching ADX push through 25 while price holds its retracement supports would be the cleaner confirmation.
⑦ OBV

Both timeframes tag OBV as early accumulation with the line above its own 20-day average, and both report the slope as flat. The two-year frame has OBV 3.99% above its MA20; the 90-day frame reads 35.4%, but that figure deserves a footnote — on the 90-day window both the OBV line and its average are negative numbers (−1,748,300 against −2,706,450), so the percentage is a gap measured against a small, negative base and it overstates how much has actually changed. It is a real improvement off the summer lows; it is not a 35% surge in demand.
Neither frame reports an OBV divergence, so on that specific test the volume picture neither confirms nor contradicts the RSI divergence flagged in section four. The shape on the panel is the more useful signal: OBV fell with price from May through July, bottomed alongside the July 31 low, and has ground upward through August without steepening. Above its average with a flat slope is the definition of an unconfirmed base — supply has stopped, but demand has not yet arrived.
Bull vs Bear
Bull Case
- Complete bullish alignment: close $9.39 > SMA5 $9.35 > SMA20 $9.24 > SMA60 $8.51, with the 60-day line rising.
- The pullback is shallow — price has held above the $9.29 23.6% retracement of the July–August swing, the mildest level on the grid.
- Above both anchored VWAPs ($8.88 from March 2025, $9.01 from August 4) — no cohort of buyers from either horizon is under water.
- Mansfield RS is improving quickly: −23.60% a month ago to −19.18% a week ago to −17.64%, slope rising.
- OBV is above its MA20 on both timeframes and tagged early accumulation; the July 31 low was matched by an OBV low that has not been undercut since.
- The MACD dead cross occurred above zero with both lines positive, and price is +34.7% off the $6.97 52-week low.
Bear Case
- Regular bearish RSI divergence on both frames: $8.30 / RSI 66.60 (Jul 30) versus $9.59 / RSI 61.55 (Sep 2) — a higher high in price on less momentum.
- MACD dead cross dated August 28, 2026, with the histogram negative at −0.022.
- Volume at 0.77× the 20-day average (449,300 against 584,770) — the advance was never confirmed by participation.
- Mansfield RS is still −17.64% against the Nasdaq Composite; improving from a deep hole is not the same as leading.
- Price remains −35.3% below the $14.51 52-week high, beneath an unfilled resistance gap running $10.78–$17.22 from March 11, 2025.
- OBV slope is flat on both frames and ADX at 24.7 is still under 25 — an accumulation tag without a rising slope or an established trend is a base, not a launch.
Scenarios
| Scenario | Probability | Path | Trigger / Invalidation |
|---|---|---|---|
| Pullback holds, swing high retested | 45% | The $9.29–$9.24 band holds on a closing basis, the MACD histogram turns back positive with both lines still above zero, and price works back to the $9.68–$9.69 cluster where the swing high and the Bollinger upper band coincide. | Trigger: a close back above $9.35 on volume above the 584,770 twenty-day average. Invalidated on a close below $9.24. |
| Range digestion between $9.05 and $9.69 | 35% | The divergence and the dead cross cap the upside while the rising averages cap the downside; price drifts between the 38.2% retracement band and the swing high, letting SMA20 catch up and the Bollinger bands stay narrow. | Trigger: repeated closes inside the band on sub-average volume. Resolves upward on a close above $9.69, downward on a close below $9.01. |
| Failed pullback | 20% | The $9.05–$9.01 band gives way, confirming the RSI divergence; price works down through the 50% retracement at $8.86 and the $8.79 lower band toward the 61.8% level at $8.66, with the rising SMA60 at $8.51 as the last structural floor. | Trigger: a close below $9.01 on above-average volume. This path fails outright on a close below $8.67; it is invalidated by a reclaim of $9.29. |
Key Levels
| Level | Role | Basis |
|---|---|---|
| $9.69 | Resistance | Bollinger upper band — the ceiling of the current 9.66% band width |
| $9.68 | Resistance | August 19, 2026 swing high and 0% of the up-swing — the anchor the retracement grid is measured from |
| $9.39 | Current close | September 4, 2026 close |
| $9.29 | Support | 23.6% retracement of the July 31–August 19 swing — the shallowest shelf, still intact |
| $9.24 | Support / pivot | SMA20 and the Bollinger mid-band at the same value — the first structural line |
| $9.05 | Support | 38.2% retracement; the $9.03 one-ATR reference and the $9.01 ninety-day anchored VWAP sit in the same band |
| $8.67 | 2× ATR stop reference | Objective invalidation — 2× the $0.358 ATR below the close, −7.63%, just under the $8.66 61.8% retracement |
What to Watch
- $9.29, then $9.24. The 23.6% retracement and the SMA20 / Bollinger mid-band sit within a nickel of each other; while closes stay above them this is a normal pause, and the first close beneath them changes the character of the move.
- Whether volume shows up before the level, not after it. At 0.77× the 20-day average, a return to $9.68 on quiet trade would be the textbook unconfirmed breakout — the thing that traps buyers in low-priced names. Expanding volume on the approach is the confirmation worth waiting for.
- The MACD histogram at −0.022. Watch whether it turns positive with both lines still above zero, or whether the pair rolls through the zero line first. Those are materially different signals from the same indicator.
- The RSI divergence. It is erased if RSI drives back above the 61.55 reading behind the September 2 high, and it only becomes meaningful if price also loses $9.24 — divergence without a broken level is a warning, not an event.
- Mansfield RS versus zero. The line has closed 5.97 points in a month but is still −17.64%. Continued improvement toward parity supports the setup; a stall in the −20s, as happened through most of 2025, would say the index is still the better place to be.
Conclusion
Past Analyses of This Stock same ticker · newest first
Other signals from this issue same publication date · 4 stocks
This analysis is an educational interpretation of chart data and is not investment advice. Probabilities and levels are subjective estimates; every investment decision, and its outcome, is your own responsibility. Chart indicators describe what price has already done — they cannot account for company news, earnings or regulatory events that have not yet occurred.
Two Week Swing · twoweekswing.com · 4,600+ stocks screened weekly