Frontline Plc
$46.12 −2.0% from the 52-week high ($47.04)
This analysis is based on closing-price data as of September 4, 2026. Whether you're researching how to buy Frontline Plc stock or you've just opened a brokerage account and are trying to time an entry, here are objective support levels and stop-loss references built from the RSI, MACD and ATR indicators.
The two-year chart shows a completed turn: a slide through late 2024 into a low near $13, most of 2025 spent building a base, and then a staircase advance that has carried price to $46.12 — up 125.3% from the $20.47 52-week low and only 2.0% below the $47.04 52-week high. Mansfield RS at +34.52% against the S&P 500 has been above zero since the autumn of 2025 and is accelerating again, which is what separates a broad-market lift from genuine leadership. The near-term picture is a clean but crowded one: SMA5, SMA20 and SMA60 are stacked in order and rising, ADX is above the strong-trend line, and OBV is in accumulation — while RSI made a lower high into this price high. This page reads that alignment and that divergence side by side.
Snapshot values as of the September 4, 2026 close
| Metric | Value | Read |
|---|---|---|
| Close | $46.12 | Above SMA5, SMA20 and SMA60 — full bullish alignment |
| 52-week high / low | $47.04 / $20.47 | −2.0% from the high, +125.3% off the low |
| SMA5 / SMA20 / SMA60 | $45.01 / $42.85 / $39.83 | Stacked in order and rising; price sits 15.8% above the 60-day line |
| Bollinger (20) upper / mid / lower | $47.42 / $42.85 / $38.28 | Band width 21.32% — expanded, and price is walking the upper half |
| aVWAP — 2y anchor (Apr 4, 2025) | $27.96 | Price is 65.0% above the long-term anchor |
| aVWAP — 90d anchor (Jun 26, 2026) | $39.82 | Short-term buyers are also well in profit; the anchor sits on SMA60 |
| RSI(14) | 67.1 (90d) · 67.1 (2y) | Below the 70 line but elevated; regular bearish divergence flagged on both frames |
| Mansfield RS vs the S&P 500 | +34.52% | Outperform, slope rising (prior week +30.51%, prior month +20.67%) |
| MACD / signal / histogram | 1.588 / 1.408 / +0.181 | Golden cross on August 13, 2026, with both lines far above zero |
| ADX(14) | 27.3 (90d) · 27.0 (2y) | Above the 25 strong-trend threshold; direction is set by price, not by ADX |
| ATR(14) | $1.560 (3.38% of price) | A moderate daily range for a shipping name — sizing is manageable |
| OBV state | 2y: early accumulation (+22.62% vs MA20, flat) · 90d: accumulation (+124.35%, rising) | Above its MA20 on both frames; the short frame is far stronger than the long one |
| Volume (last / 20-day avg) | 3,088,100 / 2,326,700 — 1.33× | The advance into the high came on above-average trade, not thin trade |
| 1× / 2× ATR stop reference | $44.56 / $43.00 | −3.38% / −6.77% from the close |
① Price & Moving Averages
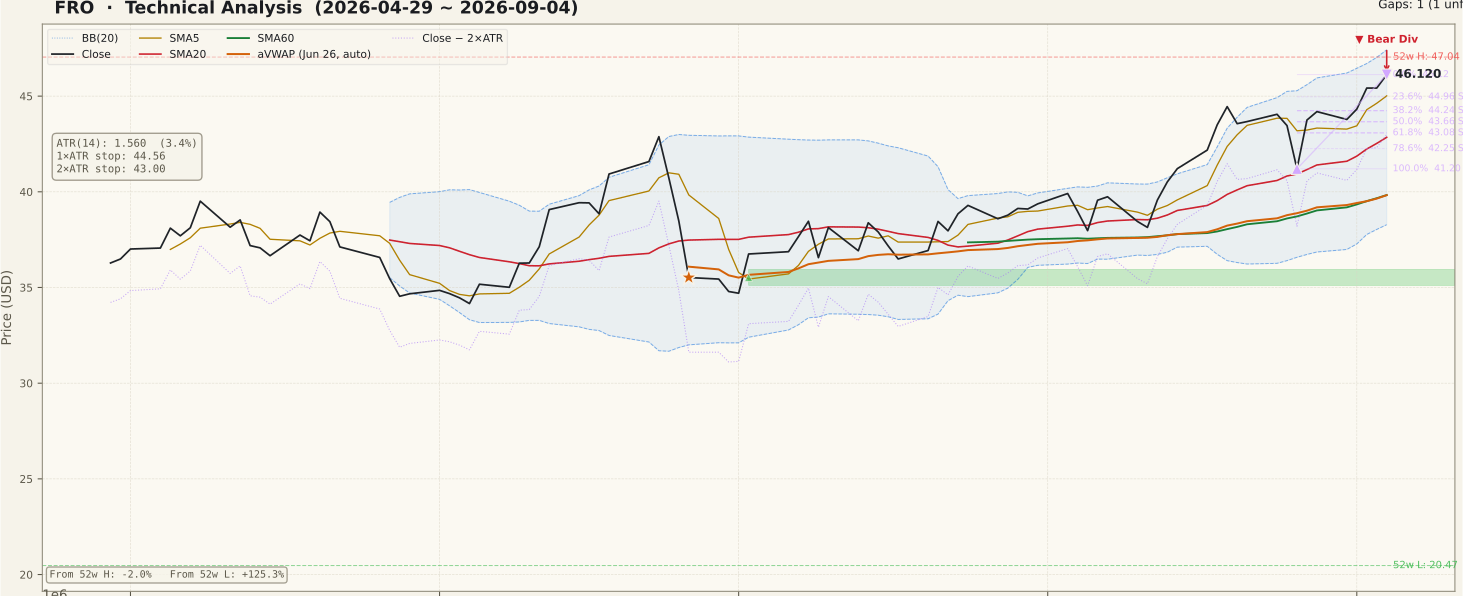
This is the cleanest structural picture on the page. The close of $46.12 sits above SMA5 $45.01, which sits above SMA20 $42.85, which sits above SMA60 $39.83 — the textbook bullish stack, with all three lines rising. The 90-day panel shows how recently that order was assembled: through May and June the short lines crossed back and forth around a flat 20-day average, and the stack only settled into place at the end of July. It has held every session since, which is a meaningfully longer run of alignment than anything else in this window.
The cost of that clean structure is distance. Price is 2.5% above SMA5, 7.6% above SMA20 and 15.8% above SMA60, so a routine mean-reversion move back to the 20-day line is a $3.27 give-back from here. Overhead, the Bollinger upper band at $47.42 and the $47.04 52-week high form a tight cluster 2.0-2.8% above the close, and band width of 21.32% says the bands are already expanded rather than pinched — the easy part of the expansion has happened. Both anchored VWAPs are far below price: $27.96 from the April 4, 2025 anchor on the two-year chart and $39.82 from the June 26, 2026 anchor on the 90-day chart, the latter effectively sitting on SMA60. No cohort of buyers from either anchor is underwater, so there is no obvious supply shelf between here and the 60-day line.
Retracement levels are measured across the current up-swing, from the August 26 low of $41.20 to the September 4 high of $46.12 — a swing barely a week and a half old, so its shelves are young. The 23.6% line at $44.96 sits almost on top of SMA5, the 38.2% line at $44.24 and the 50% line at $43.66 come next, and the 100% line returns to $41.20. The only unfilled gap on the 90-day frame is a support gap at $35.11-$35.94 dated July 2, 2026, well below the market; the two-year frame adds three more unfilled support gaps, all far lower still. There is no overhead gap acting as a magnet.
② Volume

Friday traded 3,088,100 shares against a 20-day average of 2,326,700 — 1.33× normal, on an up close that made the high of the swing. Volume confirming direction is the detail that separates a durable move from an unconfirmed one, and here the heaviest recent session landed on the buy side rather than on a give-back.
It is worth keeping the scale honest. At 1.33× this is above-average participation, not a blow-off: the 90-day panel shows the 2×-plus spikes clustered in early June and late June, around the sharp drop into early July, and nothing in the recent advance approaches those bars. The 20-day average itself has been drifting sideways near 2.3 million while price has climbed through August, so the advance has been steady rather than frenzied. That is a healthier profile than a volume surge at the highs, but it also means the move has not yet drawn the kind of participation that typically accompanies a decisive break of a 52-week high.
③ MACD

MACD registered a golden cross on August 13, 2026, and the two lines have separated since: the MACD line reads 1.588 against a signal at 1.408, with the histogram positive at +0.181. Both lines are far above zero, which frames this as momentum strengthening inside an established trend rather than a fresh turn off a base — crosses that occur well below zero mark the early stage of a move, and this one does not.
The 90-day panel shows the shape behind those numbers. Through May and early July the two lines converged repeatedly and produced a cluster of crosses in quick succession — the pattern MACD always produces in sideways price action, and the classic trap for newer traders who treat each cross as a fresh signal. Since mid-August the lines have run apart and stayed apart, which is the qualitative difference between the current reading and the noise that preceded it. The histogram is the thing to track: at +0.181 it is positive but has been narrowing from its late-August peak, meaning the rate of improvement is easing even as the level stays constructive.
④ RSI

RSI reads 67.1 on the 90-day frame and 67.1 on the two-year frame — elevated, below the 70 overbought line, and consistent with a trending market rather than an exhausted one. RSI in the 60s during an advance is normal and is not by itself a warning; the 90-day panel shows the indicator has spent most of August above 55 without ever pushing decisively through 70.
The divergence is the reason this section matters. Both frames flag a regular bearish divergence between August 19, 2026 ($44.45, RSI 70.92) and September 4, 2026 ($46.12, RSI 67.13) — a higher high in price against a lower high in RSI, a gap of 3.79 RSI points. That is a wider separation than a marginal reading, and the two frames agree, which removes the possibility that it is a windowing artifact. What it is not is a top: a divergence is a possibility of exhaustion, and it means nothing until price also fails at a level. It is erased outright if RSI drives back above 70.92 on a further high, and it only becomes actionable if price loses SMA5 $45.01 and then the retracement shelves beneath. Reading a divergence as a signal on its own, before any price confirmation, is one of the most common ways newer traders exit a working trend early.
⑤ Mansfield Relative Strength

Mansfield RS reads +34.52% against the S&P 500 — clearly in outperform territory, with a rising slope. Because the measure is anchor-free, the 90-day and two-year frames carry the same value, and the two-year panel supplies the context the short frame cannot: the line spent all of late 2024 and most of 2025 below zero, crossed above it in the autumn of 2025, and has stayed positive since. That crossover is what marks a change of leadership rather than a bounce.
The slope is currently supportive rather than a caveat. The prior-week reading was +30.51% and the prior-month reading was +20.67%, so the weekly change is +4.02 points and the monthly change is +13.85 points. In positive territory a positive change means accelerating outperformance — FRO is beating the index by a widening margin, and has been rebuilding since the mid-year dip toward +17 visible on the 90-day panel. Note also that this is well short of the roughly +75 peak the two-year panel shows in March 2026, so the current reading is a recovery of leadership rather than a new extreme.
⑥ ATR & ADX

ATR(14) is $1.560, or 3.38% of the $46.12 close — a moderate daily range, and considerably tamer in percentage terms than the small-cap names that usually populate this screen. That translates directly into the stop references: $44.56 at 1× ATR (−3.38%) and $43.00 at 2× ATR (−6.77%). A stop placed tighter than roughly one ATR sits inside ordinary daily movement and will be triggered by noise rather than by a change in structure. The two-year panel shows ATR easing from about $2.00 at the June volatility peak to $1.56 now, so the trend has been getting calmer, not wilder, as it has extended.
ADX(14) reads 27.3 on the 90-day frame and 27.0 on the two-year frame — above the 25 line that separates a strong trend from a forming one, and rising off the low-20s where it sat through most of August. ADX measures strength, not direction, so the number does not vote bullish on its own; paired with a rising price stack, though, it says the current move has directional conviction behind it. Rising ADX alongside falling ATR is an unusual and generally constructive combination: the market is trending more decisively while moving less violently.
⑦ On-Balance Volume

The two timeframes carry different tags and both should be read. On the 90-day frame OBV is tagged accumulation — 15,921,400 against an MA20 of 7,096,805, so 124.35% above the average with a rising slope. On the two-year frame it is tagged early accumulation — 47,833,100 against 39,008,505, 22.62% above the average, but with a flat slope. Both frames agree that OBV is above its own moving average; they disagree about momentum.
That split is the honest reading of the volume picture: buying pressure over the last three months has been strong and one-directional, while the two-year accumulation trend has only recently re-engaged after a long plateau. The 90-day panel shows OBV bottoming in early June, climbing through July and August and making a new window high alongside price on the last session — no negative OBV divergence is flagged on either frame, so volume is confirming price here even as RSI is not. When an oscillator and a volume measure disagree, the reasonable position is that neither has been settled yet.
Bull vs Bear
Bull Case
- Full moving-average alignment: SMA5 $45.01 > SMA20 $42.85 > SMA60 $39.83, all rising, in place since late July.
- Mansfield RS +34.52% versus the S&P 500 and accelerating — +4.02 points week over week, +13.85 over the month.
- MACD golden cross dated August 13, 2026, with both lines far above zero (1.588 / 1.408) and the histogram positive at +0.181.
- OBV is above its MA20 on both frames — +124.35% and rising on the 90-day, +22.62% on the two-year — with no volume divergence flagged.
- ADX 27.3 is above the strong-trend threshold and rising, while ATR has eased from about $2.00 in June to $1.560 — conviction up, violence down.
- Both anchored VWAPs sit far below price ($27.96 2y, $39.82 90d), so no cohort of buyers from either anchor is trapped at a loss.
Bear Case
- Regular bearish RSI divergence on both frames: $44.45 / RSI 70.92 (Aug 19) versus $46.12 / RSI 67.13 (Sep 4) — 3.79 points of separation.
- Price is 7.6% above SMA20 and 15.8% above SMA60; a routine reversion to the 20-day line is a $3.27 give-back.
- The $47.42 upper Bollinger band and the $47.04 52-week high form an untested overhead cluster 2.0-2.8% above the close.
- Band width is already 21.32% — the bands are expanded, not compressed, so the easy part of the expansion is behind the move.
- Two-year OBV slope is flat while the 90-day is rising — the longer frame has not yet confirmed the August-September push.
- The fibonacci grid is measured across a swing that only began on August 26 ($41.20), so its retracement shelves are young and have never been tested.
Scenarios
| Scenario | Probability | Path | Trigger / Invalidation |
|---|---|---|---|
| Continuation through the 52-week high | 40% | Price holds above SMA5 $45.01, clears the $47.04 52-week high and the $47.42 upper band, and the RSI divergence is erased by a reading back above 70.92 as the stack keeps rising underneath. | Trigger: a close above $47.04 on volume above the 2,326,700 twenty-day average. Invalidated on a close below $44.24. |
| Sideways digestion of the extension | 35% | The overhead cluster holds and price works between roughly $45.01 and $43.08 while SMA20 rises toward the market, RSI resets out of the upper 60s and the young retracement shelves at $44.96, $44.24 and $43.66 get their first test. | Trigger: a close below $45.01 without follow-through. Resolves bullishly on a reclaim of $46.12; it fails on a close below $43.00. |
| The divergence resolves lower | 25% | Price gives back the full August 26 - September 4 swing, loses SMA20 and the $42.85 Bollinger mid-band together, and works down toward $41.20 and then the $39.83 SMA60, where the $39.82 90-day anchored VWAP sits at the same price. | Trigger: a close below $43.00, ideally confirmed by Mansfield RS rolling over from +34.52%. Invalidated by a reclaim of $45.01. |
Key Levels
| Level | Role | Basis |
|---|---|---|
| $47.42 | Resistance | Bollinger (20) upper band — the outer edge of the current expansion, 2.8% above the close |
| $47.04 | Resistance | 52-week high — the level that defines the trend's next test, 2.0% above the close |
| $46.12 | Current close | September 4, 2026 close; also the 0% anchor of the August 26 - September 4 up-swing |
| $45.01 | Support / pivot | SMA5, with the 23.6% retracement at $44.96 immediately beneath — the first line to hold |
| $44.24 | Support | 38.2% retracement of the current swing; the 1× ATR reference at $44.56 sits just above |
| $43.66 | Support | 50% retracement, with the 61.8% level at $43.08 immediately below |
| $43.00 | 2× ATR stop reference | Objective invalidation — 2× the $1.560 ATR below the close, −6.77%; SMA20 and the Bollinger mid-band at $42.85 sit just beneath |
What to Watch
- $47.04, then $47.42. The 52-week high and the upper Bollinger band form one narrow overhead zone. A close through it on above-average volume is the confirmation this setup has not yet produced; a rejection there would give the RSI divergence its first piece of price evidence.
- SMA5 at $45.01. It has capped every pullback since the stack formed in late July and the 23.6% retracement at $44.96 sits on top of it. Losing it is the first mechanical sign the short-term push has stalled — not a trend break, but a change of state.
- Whether the RSI divergence gets price confirmation. It is erased if RSI drives back above the 70.92 reading from August 19; it only becomes meaningful if price also fails at $45.01 or lower. Divergence without price failure is a caution, not a signal.
- The two-year OBV slope. It is flat while the 90-day slope is rising. If the longer frame turns up and joins the short one, volume is confirming the advance across both horizons; if the 90-day slope flattens instead, the divergence in RSI gains a second voice.
- Mansfield RS acceleration. At +4.02 points week over week the leadership is widening, and the two-year panel shows there is room to roughly +75 before the March 2026 extreme is matched. Watch whether the weekly change stays positive or flattens out — sustained deceleration well above zero is how leadership normally ends.
Conclusion
Past Analyses of This Stock same ticker · newest first
Other signals from this issue same publication date · 4 stocks
This analysis is an educational interpretation of chart data and is not investment advice. Probabilities and levels are subjective estimates; every investment decision, and its outcome, is your own responsibility. Chart indicators describe what price has already done — they cannot account for company news, earnings or regulatory events that have not yet occurred.
Two Week Swing · twoweekswing.com · 4,600+ stocks screened weekly