Robert Half Inc.
$35.29 −17.3% from 52-week high
This analysis is based on closing-price data as of July 24, 2026. Whether you're researching how to buy Robert Half Inc. stock or you've just opened a brokerage account and are trying to time an entry, here are objective support levels and stop-loss references built from the RSI, MACD and ATR indicators.
On the two-year chart, RHI is early in a recovery: a long decline through 2025 gave way to a base near the 52-week low of $21.83, and the stock has since climbed +61.7% off that low while Mansfield RS turned positive versus the S&P 500 for the first time in the window. The short-term picture is more fraught — a vertical July run to $41.83 reversed hard, and four heavy-volume down sessions have dropped the close to $35.29, below the 5- and 20-day averages, with a fresh MACD dead cross printed on the July 24 bar. The question this week is whether the pullback stabilizes in the $34.42–$36.00 retracement zone or unwinds the entire swing.
Snapshot as of Jul 24, 2026 close
| Item | Value | Read |
|---|---|---|
| Close | $35.29 | Below SMA5/SMA20, above SMA60 |
| 52-week high / low | $42.65 / $21.83 | −17.3% from high · +61.7% off low |
| SMA 5 / 20 / 60 | $39.37 / $35.81 / $31.00 | Short averages overhead; SMA60 rising below |
| Bollinger (20) | $43.19 / $35.81 / $28.44 | Width 41.19% — high-volatility regime |
| aVWAP 90d (Apr 24 anchor) | $31.05 | Price above — recent buyers still in profit |
| aVWAP 2y (Jan 30 anchor) | $28.32 | Price above — longer anchor also supportive |
| RSI (14) | 49.96 | Full reset from overbought to the midline |
| Mansfield RS vs S&P 500 | +9.64% | Outperforming; weekly comparison slowing (see ⑤) |
| MACD (12,26,9) | 2.18 / 2.22 / −0.04 | Dead cross on Jul 24 — high-altitude momentum stall |
| ADX (14) | 30.14 | Strong trend (strength, not direction) |
| ATR (14) | $2.08 (5.90%) | Elevated daily range — size positions accordingly |
| OBV | 2y: early distribution · 90d: improving | Timeframes disagree — see ⑦ |
| Volume (Jul 24) | 4,301,800 (1.73× avg) | Heavy volume on a down day |
| 1× / 2× ATR stop | $33.21 / $31.13 | Objective invalidation references |
① Price & Moving Averages
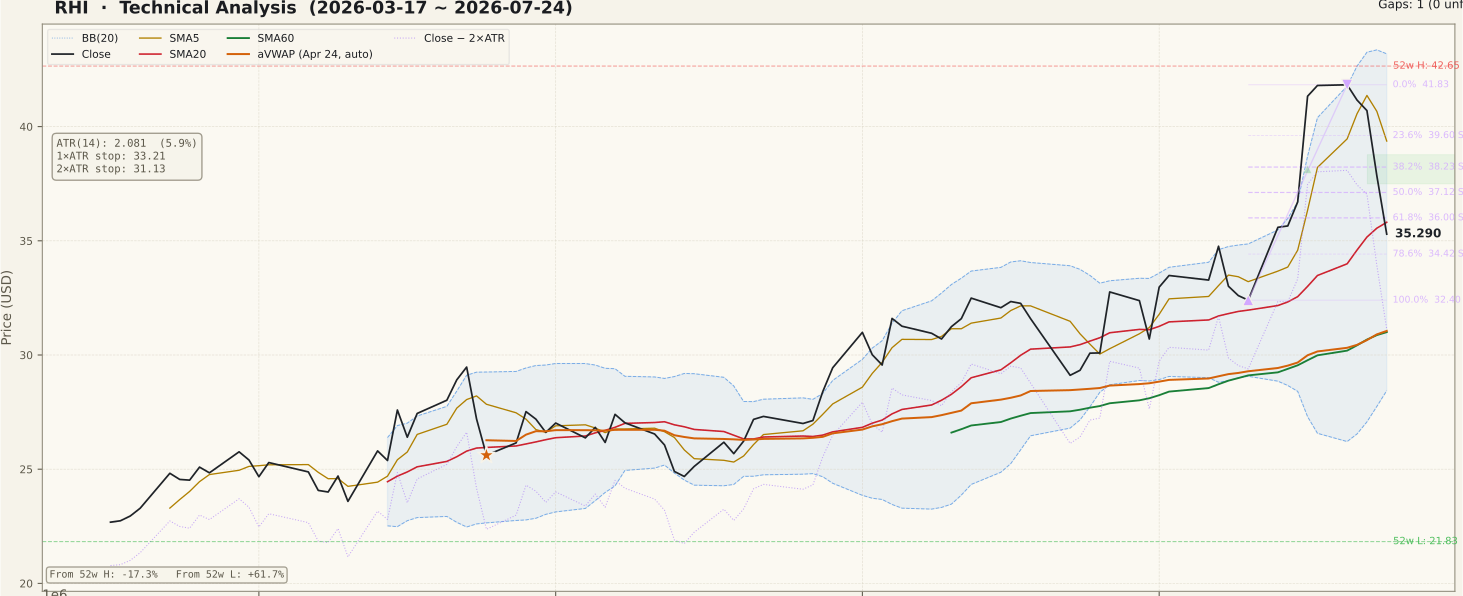
The 90-day chart shows a stair-step advance from the mid-$20s that accelerated into a vertical July leg, peaking at $41.83 on July 20 just under the 52-week high of $42.65. The reversal since has been equally fast: the close at $35.29 sits below SMA5 ($39.37) and SMA20 ($35.81), though the rising SMA60 ($31.00) and both anchored VWAPs remain well underneath. Measured against the July 10 → July 20 up-swing ($32.40 → $41.83), price has already retraced past the 61.8% level at $36.00 and is testing the zone above the 78.6% level at $34.42 — a deep retracement that puts the swing structure on notice. The Bollinger bands are wide open (width 41.19%), so daily swings should stay large in either direction. The one unfilled gap on the two-year chart ($66.74–$68.37, from January 30, 2025) is far overhead and not relevant to near-term trading.
② Volume

Friday's volume was 4,301,800 shares against a 20-day average of 2,482,460 — 1.73× normal — and it came on a down day. The chart shows the same pattern across the whole pullback: the heaviest bars of the past two weeks are red. Volume expansion confirmed the July breakout on the way up, but sellers have now taken over the tape at above-average intensity, which is the classic footprint of profit-taking or a reaction to news rather than a quiet drift. Until down-day volume contracts relative to up-day volume, the burden of proof is on buyers.
③ MACD

MACD printed a dead cross on July 24 — the most recent bar of this dataset — with the MACD line at 2.18 slipping under the signal at 2.22 and the histogram flipping to −0.04. Two things matter here. First, this is a high-altitude cross: both lines are far above zero, so it marks momentum loss after a strong run, not (yet) a downtrend. Second, crosses that occur this fresh can whipsaw — a one-day-old signal is a warning to tighten risk, not a standalone verdict. A deepening negative histogram over the coming sessions would confirm the stall; a quick re-cross higher would neutralize it.
④ RSI

RSI sits at 49.96, almost exactly on the midline, after spending the July run in overbought territory above 70. That is a complete momentum reset in four sessions — fast, but not yet broken: in uptrends the 40–50 area often acts as the pullback floor, so the current reading is the decision zone rather than a bearish reading in itself. No RSI divergence is flagged in the data for either timeframe. What would turn this bearish is a slice below the mid-40s that holds, which would say the pullback has become a trend change rather than a reset.
⑤ Mansfield Relative Strength

Mansfield RS stands at +9.64% vs the S&P 500 — RHI is outperforming the benchmark, and the two-year chart shows how notable that is: this stock spent essentially the entire window in negative RS territory before crossing above zero in July. The month-over-month change is strongly positive (from −9.03 a month ago, an improvement of about +18.7 points), confirming a genuine regime shift. The week-over-week comparison, however, cuts the other way: RS was 28.25 a week ago, so the reading has come down about 18.6 points — outperformance is slowing sharply as the pullback unfolds. In the positive zone that counts as deceleration, not failure; the line losing the zero level would be the failure signal.
⑥ ATR & ADX

ATR is $2.08, or 5.90% of price — a wide daily range that has expanded further during the reversal, so position sizing should assume multi-percent daily moves. ADX reads 30.14, in the strong-trend zone; remember ADX measures trend strength, not direction, and the strength it currently registers was built mostly by the July advance. The objective volatility-based references are $33.21 (1× ATR) and $31.13 (2× ATR) below the close — the 2× level conveniently sits just above the rising SMA60 at $31.00, making the low-$31s a structurally meaningful line.
⑦ OBV (On-Balance Volume)

The two timeframes disagree, and both are worth stating. On the 90-day view OBV is tagged improving — below its 20-day average (divergence −26.02%) but with a rising slope, reflecting the accumulation that powered the July leg followed by the recent heavy-volume give-back. On the two-year view OBV is in early distribution: below its average with a flat slope (divergence −3.65%), meaning the long recovery in price has not yet been matched by a convincing long-term rebuild of cumulative volume. Short-term flows improved into the rally; the longer accumulation case is still unproven, and last week's selling widened the 90-day gap. A stock making multi-month price highs while long-horizon OBV stays flat is a non-confirmation to monitor, not to ignore.
Bull Case vs Bear Case
Bull Case
- Mansfield RS is positive (+9.64%) vs the S&P 500 for the first time in the two-year window, up ~18.7 points month-over-month.
- Price holds above the rising SMA60 ($31.00) and both anchored VWAPs ($31.05 / $28.32) — the recovery structure is intact.
- The stock is +61.7% off its 52-week low with no unfilled overhead gap until $66.74–$68.37.
- RSI reset from overbought to the midline (49.96) without breaking down — a textbook pullback zone in an uptrend.
- The close sits in the 61.8–78.6% retracement band ($36.00–$34.42) near the SMA20 — a defined area where swing buyers can be measured against a tight invalidation.
- ADX 30.14 confirms a strong trend regime built during the advance; 90-day OBV slope is still rising.
Bear Case
- Fresh MACD dead cross on July 24 with the histogram flipping negative — momentum stalled right at the highs.
- Four heavy down sessions took price below SMA5 and SMA20; Friday's decline came on 1.73× average volume.
- The pullback has already consumed more than 61.8% of the July swing — retracements this deep often round-trip to the swing low ($32.40).
- Weekly Mansfield RS change is about −18.6 points (28.25 → 9.64) — relative strength is decelerating fast.
- Two-year OBV remains in early distribution (below its average, flat slope) — the long-term accumulation case is unconfirmed.
- The speed and volume of the reversal fit a news-driven pattern; a fundamental catalyst could override any technical support.
Scenarios
| Scenario | Probability | Path | Trigger / Invalidation |
|---|---|---|---|
| Stabilize and rebase | ~40% | The $34.42–$36.00 retracement band holds, down-day volume dries up, and price rebuilds above the SMA20 ($35.81) toward $39.60 and eventually the $41.83 swing high. | Trigger: daily close back above $36.00 with fading sell volume. Invalidated by a close below $34.42. |
| Full swing retest | ~35% | Sellers press through the 78.6% level and price completes the round trip to the $32.40 swing low, near the 2× ATR stop ($31.13) and rising SMA60 ($31.00), where the larger uptrend gets its real test. | Trigger: close below $34.42 on above-average volume. Invalidated by a fast reclaim of $36.00. |
| Breakdown | ~25% | The $32.40–$31.00 support cluster fails, MACD extends below its signal, RS loses the zero line, and price sinks toward the lower Bollinger band ($28.44) / 2-year aVWAP ($28.32). | Trigger: decisive close below $31.00. This scenario would invalidate the entire July swing thesis. |
Key Levels
| Price | Role | Basis |
|---|---|---|
| $41.83 | Resistance | July 20 swing high — 0% of the swing (just under the 52-week high $42.65) |
| $37.12 | Resistance | 50% retracement of the Jul 10 → Jul 20 swing, now overhead |
| $36.00 | Resistance | 61.8% retracement — first level to reclaim, near SMA20 $35.81 |
| $35.29 | Current | Jul 24 closing price |
| $34.42 | Support | 78.6% retracement — last fib defense before the swing low |
| $32.40 | Support | July 10 swing low — 100% of the swing |
| $31.13 | Stop (2× ATR) | Objective invalidation; confluence with rising SMA60 $31.00 |
What to Watch
- The $34.42–$36.00 band. A held retest and reclaim of $36.00 keeps the swing alive; a volume-backed close below $34.42 points to the $32.40 retest.
- Down-day vs up-day volume. The pullback is currently running at 1.73× average volume — stabilization requires that ratio to flip.
- MACD histogram follow-through. The July 24 dead cross is one day old; a deepening negative histogram confirms it, a quick re-cross negates it.
- Mansfield RS vs the zero line. Holding positive keeps the regime-change thesis intact; losing zero would say July was a spike, not a shift.
- The news tape. A ~16% four-session reversal on heavy volume in earnings season is characteristic of a fundamental reaction — identify the catalyst before trusting any level.
Conclusion
Past Analyses of This Stock same ticker · newest first
This analysis is an educational interpretation of chart data and is not investment advice. Probabilities and levels are subjective estimates; every investment decision, and its outcome, is your own responsibility. For stocks showing signs of a fundamental shock, technical signals alone are not a sufficient basis to buy.
Two Week Swing · twoweekswing.com · 4,600+ stocks screened weekly