Robert Half Inc
$32.40 −25.8% from 52-week high
This analysis is based on closing-price data as of July 10, 2026. Whether you're researching how to buy Robert Half Inc stock or you've just opened a brokerage account and are trying to time an entry, here are objective support levels and stop-loss references built from the RSI, MACD and ATR indicators.
Robert Half is a deep-recovery story at a delicate moment. After a punishing two-year decline from the mid-$70s to a base near $21.83, the stock has rebuilt to $32.40 — up +48.4% from the 52-week low — and its relative strength even poked above zero last week for the first time in the window. But the July 7 push to $34.76 came with a confirmed bearish RSI divergence, MACD printed a dead cross on the July 10 close, and on-balance volume sits in early distribution. The recovery trend is intact above its moving averages; the question for the next two weeks is whether the $31.93–$31.96 confluence can absorb this pullback, because the warning lights are on.
Snapshot all values from the July 10, 2026 chart data
| Item | Value | Read |
|---|---|---|
| Close | $32.40 | −25.8% from 52w high / +48.4% from 52w low |
| 52-week high / low | $43.69 / $21.83 | deep decline, long base, 2026 recovery in progress |
| SMA 5 / 20 / 60 | $33.21 / $31.96 / $29.11 | rising stack; close below SMA5 — short-term pullback |
| Bollinger (20, 2) | $34.86 / $31.96 / $29.07 | width 18.13%; price back inside the upper half |
| aVWAP 90d | $29.25 (anchor Apr 24, 2026) | price above — recent buyers in profit |
| aVWAP 2y | $27.42 (anchor Jan 30, 2026) | price above — base-era buyers in profit |
| RSI (14) | 54.4 | bearish divergence confirmed (Jun 4 vs Jul 7 peaks) |
| MACD (12, 26, 9) | 0.99 / signal 1.03 / hist −0.04 | dead cross on July 10, 2026 — fresh momentum warning |
| Mansfield RS (vs the S&P 500) | −2.8% | +3.9 pts vs a month ago, but back below zero after last week’s +0.6 |
| ADX (14) | 19.8 | ranging / trend strength still forming |
| ATR (14) | $1.51 (4.65%) | elevated daily swing — size positions accordingly |
| OBV 2y / 90d | Early distribution / Early distribution | below MA20 with a flat slope on both timeframes |
| Volume vs 20d avg | 0.55× | quiet tape — the July rally was not volume-confirmed |
| 1× / 2× ATR stop | $30.90 / $29.39 | 2× ATR stop is −9.3% below the close |
① Price & Moving Averages
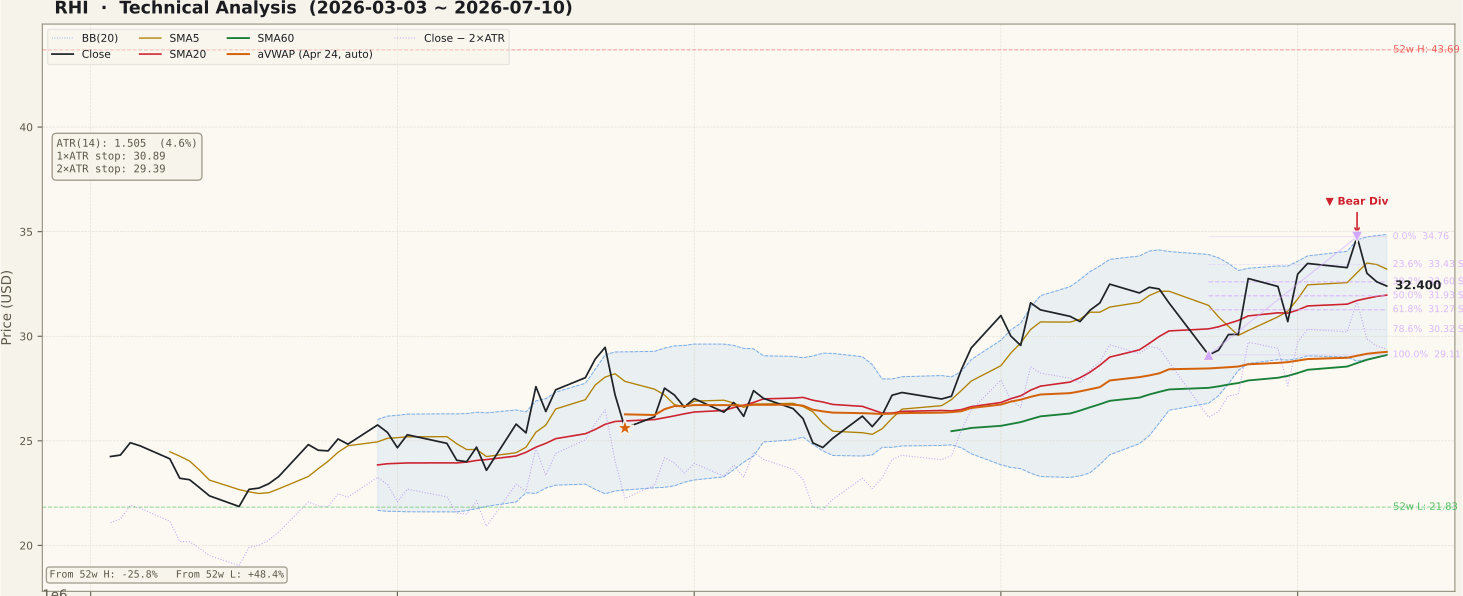
The two-year chart is dominated by a long, orderly downtrend from roughly $76 in late 2024 to the $21.83 52-week low, followed by months of basing and a 2026 recovery that has now retraced to $32.40. On the 90-day view the structure is bullish: higher lows since March, a rising stack (SMA5 $33.21 > SMA20 $31.96 > SMA60 $29.11) and price above both anchored VWAPs (90d $29.25, 2y $27.42). The close has slipped below the 5-day line after the July 7 high at $34.76 — a normal first pullback in form. Measured against the June 22 → July 7 swing ($29.11 → $34.76), price sits just under the 38.2% retracement at $32.60, with the 50% level at $31.93 landing almost exactly on the SMA20 / Bollinger mid at $31.96 — the key confluence shelf. Overhead, the entire 2024–25 downtrend is unresolved supply, including an unfilled gap at $66.74–$68.37 far above — a reminder of how much repair work remains.
② Volume

The last session traded 1,317,264 shares versus a 20-day average of 2,410,593 — 0.55× normal. The pullback itself is happening on light volume, which is the less-threatening variety, but the same problem applies to the advance: the June–July leg to $34.76 did not print a persistent volume expansion, and a rally without volume confirmation deserves skepticism — especially with the distribution signals stacking up in the panels below. For the recovery to earn trust, a reclaim of $33.43 (the 23.6% retracement) needs to come with volume back above the 20-day average, not another drift on half-average turnover.
③ MACD

MACD printed a dead cross on July 10, 2026 — the as-of date of this analysis — with the MACD line at 0.99 slipping under the signal at 1.03 and the histogram turning negative at −0.04. Both lines remain well above zero, so this is a momentum pause inside a still-standing recovery rather than a trend reversal on its own. But context matters: a dead cross arriving together with a confirmed RSI bearish divergence (next panel) is how intermediate tops often announce themselves. The constructive counter-path is a shallow dip and quick re-cross — the shape the June 22 low produced. Until the histogram turns positive again, momentum favors patience over chasing.
④ RSI

RSI(14) reads 54.4, but the level is not the story — the shape is. The data flags a confirmed bearish divergence: on June 4 price peaked at $31.60 with RSI at 70.4, and on July 7 price pushed higher to $34.76 while RSI managed only 65.6. Price made a higher high; momentum made a lower high. That is a classic warning that the advance is running on thinner participation. Two cautions cut both ways here: a divergence signals the possibility of a top, not a certainty — it is only “paid” when price confirms by breaking support — and RSI holding above 50 still leaves the pullback-within-uptrend read alive. Treat the divergence as a reason to demand confirmation before adding risk, not as a standalone sell signal.
⑤ Mansfield Relative Strength

Mansfield RS vs the S&P 500 stands at −2.8%. The month-scale trend is genuinely improving — a month ago the reading was −6.7%, so RHI has gained about +3.9 points of relative ground, and the slope of the line is rising. The disappointment is fresher: last week RS actually crossed to +0.6%, its first taste of outperformance, and this week’s −2.8% means it slipped straight back below the zero line — a −3.4 point giveback. A failed first attempt at zero is common and not fatal, but it keeps RHI classified as an underperformer. The RS zero line is the single cleanest tell in this chart: holding above it on the next attempt would materially upgrade the thesis; repeated rejections would confirm the divergence camp.
⑥ ATR & ADX

ATR(14) is $1.51, or 4.65% of price — a wide daily range for a $32 stock, so position sizing should assume multi-percent daily swings. ADX at 19.8 sits just under the 20–25 “forming” zone: the recovery has not yet hardened into a strong trend, which is consistent with the ranging, two-steps-forward character of the 90-day chart. Keep in mind ADX measures strength, not direction — if the divergence resolves downward with force, ADX rising would confirm the down move. The objective risk anchors: $30.90 (1× ATR) and $29.39 (2× ATR, −9.3%), the latter sitting just under the $29.11 swing low — a structurally sensible invalidation point.
⑦ OBV (On-Balance Volume)

OBV is the bears’ second witness. On both timeframes the state is early distribution: OBV sits below its 20-day average with a flat slope. On the two-year window the shortfall is mild (−1.3% versus the average), but on the 90-day window OBV has fallen well below its average (divergence reading −83.6%, a figure exaggerated by the average hovering near zero — read the direction, not the magnitude). The pattern rhymes with the RSI panel: price ground to new recovery highs in July while cumulative volume flow failed to follow. This is a non-confirmation, not a collapse — OBV flattening rather than plunging — but it means the burden of proof is on the buyers to show up with volume.
Bull Case vs Bear Case
Bull Case
- Recovery structure intact: higher lows since March, price above SMA20 ($31.96) and SMA60 ($29.11), both rising.
- Up 48.4% from the 52-week low with price above both anchored VWAPs — the base-era buyer pool is in profit, limiting forced selling.
- Mansfield RS improved +3.9 points over the past month and briefly crossed above zero — the relative repair is close.
- Tight confluence support at $31.93–$31.96 (50% retracement + SMA20 + Bollinger mid) sits just 1.4% below the close.
- The pullback so far is shallow (38.2% zone) on light volume — the orderly kind, with the $29.11 swing low untouched.
- MACD dead cross occurred with both lines still well above zero — historically these often resolve as pauses when structure holds.
Bear Case
- Confirmed RSI bearish divergence: July 7 higher high at $34.76 with RSI 65.6 vs 70.4 on June 4 — momentum did not confirm the new high.
- MACD dead cross printed on the July 10 close — a fresh, dated momentum warning stacking on the divergence.
- OBV in early distribution on both timeframes, below its 20-day average — volume flow failed to confirm the July high.
- RS fell back below zero (−3.4 points in a week) after its first cross — the leadership attempt was rejected.
- Volume at 0.55× average — the entire July leg lacks conviction turnover.
- Still −25.8% below the 52-week high, with the whole 2024–25 downtrend (and an unfilled gap at $66.74–$68.37) as overhead supply.
Scenarios
| Scenario | Probability | Path | Trigger / Invalidation |
|---|---|---|---|
| Deeper retracement first | ~45% | The divergence and dead cross play out: price loses $31.93–$31.96, probes $31.27 (61.8%) and possibly the $30.32–$30.90 zone (78.6% / 1× ATR) before buyers re-engage. | Trigger: close below $31.93 on expanding volume. This path stays corrective while $29.39 holds. |
| Shallow dip, trend resumes | ~35% | The 38.2%–50% zone ($32.60–$31.93) absorbs the selling; price reclaims $33.43 and retests $34.76 with RS pushing back at zero. | Trigger: close above $33.43 with volume ≥ 1× the 20-day average and a positive MACD histogram. Invalidation: rejection at $33.43 on weak volume. |
| Recovery fails | ~20% | Distribution accelerates; price breaks the $29.11 swing low and the $29.39 stop, putting the whole 2026 recovery in question. | Trigger: close below $29.39 (2× ATR stop). That is the hard exit reference for the swing thesis. |
Key Levels
| Price | Role | Basis |
|---|---|---|
| $34.86 | Resistance | Upper Bollinger band (20, 2) |
| $34.76 | Resistance | July 7 swing high — 0% of the June 22 → July 7 swing; site of the bearish divergence |
| $33.43 | Support | 23.6% retracement — reclaim line for the bullish scenario |
| $32.60 | Support | 38.2% retracement — currently being tested |
| $32.40 | Current | July 10, 2026 close |
| $31.96 | Support | SMA20 / Bollinger mid; 50% retracement at $31.93 — the key confluence shelf |
| $31.27 | Support | 61.8% retracement of the same swing |
| $29.39 | Stop-loss | 2× ATR below the close (−9.3%); just under the $29.11 swing low |
What to Watch
- The $31.93–$31.96 confluence (50% retracement + SMA20) — the line between an orderly pullback and the divergence winning.
- Volume on any reclaim of $33.43 — without turnover back above the 20-day average, a bounce is suspect.
- Mansfield RS at the zero line — a second, sustained cross above zero would neutralize much of the bear case.
- MACD histogram — how long it stays negative tells you whether July 10 was a pause or a turn.
- OBV versus its 20-day average — a recovery above the average would defuse the distribution warning.
Conclusion
Past Analyses of This Stock same ticker · newest first
This analysis is an educational interpretation of chart data and is not investment advice. Probabilities and levels are subjective estimates; every investment decision, and its outcome, is your own responsibility. Indicator values are taken from closing-price data as of July 10, 2026 and are not recalculated intraday. If a stock moves sharply on news, earnings or other fundamental catalysts, do not act on technical signals alone — check the catalyst first.
Two Week Swing · twoweekswing.com · 4,600+ stocks screened weekly