Dynatrace, Inc.
$44.41 −20.0% from 52-week high
This analysis is based on closing-price data as of July 17, 2026. Whether you're researching how to buy Dynatrace, Inc. stock or you've just opened a brokerage account and are trying to time an entry, here are objective support levels and stop-loss references built from the RSI, MACD and ATR indicators.
On the two-year chart, DT is still repairing damage: the stock peaked near $55.49 in mid-2025, ground down to a $31.64 low by early 2026, and has since climbed roughly 40% off that floor in a sequence of higher lows. The recovery now sits at a pause point — price closed at $44.41, above a rising 60-day average and both anchored VWAPs, but a fresh MACD dead cross printed on July 16 and volume has thinned to about half its 20-day average. Relative strength versus the S&P 500 is still negative at −5.9%, though it has improved sharply over the past month, so the most useful lens here is a shallow pullback inside an early-stage recovery that has not yet proven itself against the broader market.
Snapshot all values from the July 17, 2026 close
| Close | $44.41 (52w high $55.49 / 52w low $31.64 · −20.0% from high, +40.4% from low) |
|---|---|
| Moving averages | SMA5 $44.81 · SMA20 $43.61 · SMA60 $40.92 — close sits just under SMA5, above SMA20 and SMA60 |
| Bollinger Bands (20) | Upper $47.35 · Mid $43.61 · Lower $39.88 · width 17.13% |
| Anchored VWAP (2y) | $38.49 (anchor Feb 9, 2026) — price above |
| Anchored VWAP (90d) | $41.32 (anchor May 13, 2026) — price above |
| RSI (14) | 55.4 — neutral-bullish zone, no divergence flagged |
| Mansfield RS (vs the S&P 500) | −5.91% (underperforming), slope rising · prev week −9.57 · prev month −15.37 |
| MACD (12,26,9) | MACD 0.98 vs signal 1.04 · histogram −0.06 · dead cross on Jul 16, 2026 |
| ADX (14) | 15.9 — ranging / weak trend strength |
| ATR (14) | $1.78 per day (4.02% of price) |
| OBV | 2y: accumulation, above MA20, rising (+463.66% vs MA20) · 90d: accumulation, above MA20, rising (+72.90%) |
| Volume | 2,631,400 shares · 0.48× the 20-day average (5,509,280) |
| ATR stops | 1×ATR $42.63 · 2×ATR $40.84 |
① Price & Moving Averages
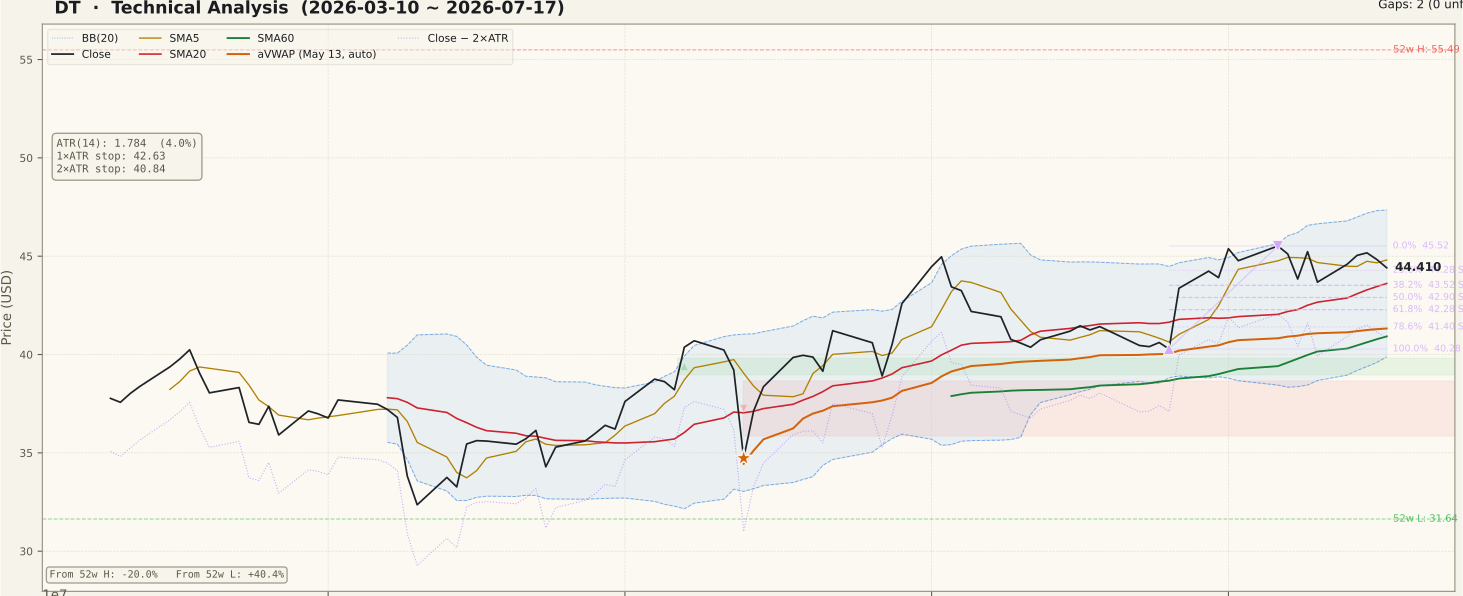
The 90-day window shows a genuine recovery structure: a base near $32–35 in March and April, a higher low at $40.28 on June 25, and a push to a swing high of $45.52 on July 6. Price has since drifted sideways-to-lower and closed at $44.41 — just below the 5-day average ($44.81) but still above the 20-day ($43.61) and a clearly rising 60-day ($40.92). That stacking, with the close held in the upper half of the Bollinger channel (mid-band $43.61, upper band $47.35), is what a routine pullback looks like rather than a breakdown. The retracement of the June–July up-swing has so far been shallow, holding around the 23.6% level at $44.28. On the two-year chart, however, the ceiling matters: DT still trades 20.0% below its 52-week high, with a broad supply zone overhead from the $50–55 area where the stock spent much of 2024–2025. All four gaps on the two-year chart and both gaps on the 90-day chart have been filled, so there are no open gap magnets in either direction.
② Volume

Friday's turnover was 2,631,400 shares — only 0.48× the 20-day average of 5,509,280. Volume has been contracting through the entire July consolidation, which cuts both ways. The constructive reading: sellers are not pressing into the pullback, which is typical of a digestion phase after an advance. The cautious reading: the July 6 push to $45.52 was not accompanied by a decisive volume expansion either, so the rally has not yet been confirmed by heavy participation. A breakout attempt above $45.52 on volume below the 20-day average would be a classic trap setup that beginners often chase — the level only means something if turnover expands with it.
③ MACD

MACD printed a dead cross on July 16 — the line (0.98) slipped below its signal (1.04), leaving the histogram marginally negative at −0.06. Context tempers the alarm: the cross occurred well above the zero line, which historically marks momentum cooling inside an uptrend more often than a trend reversal, and the gap between the two lines is razor-thin. The 90-day panel shows the same pattern in mid-June — a shallow dead cross above zero that resolved into another leg higher within a few weeks. Still, a fresh dead cross is a fresh dead cross: momentum is no longer accelerating, and if the histogram deepens over the coming sessions the pullback scenario gains weight. Watch whether the histogram flips back positive (an early re-acceleration signal) or stretches below −0.2 and drags MACD toward the zero line.
④ RSI

RSI sits at 55.4 — comfortably in the neutral-bullish band, far from both the overbought line at 70 and the oversold line at 30. Through the recovery since May, RSI has repeatedly pushed into the 60s on rallies and held the mid-40s on dips, which is characteristic of a market whose baseline has shifted upward: pullbacks stop being oversold events and start being resets. No divergence is flagged in the data on either timeframe, so there is no early-warning signal of exhaustion here — but equally no oversold spring to lean on. At this reading RSI is a confirming indicator, not a timing tool; a dip that holds the 45–50 area would keep the recovery pattern intact, while a slide below 40 would suggest the pullback is deeper than routine.
⑤ Mansfield Relative Strength

This is the most interesting panel on the chart. Mansfield RS versus the S&P 500 stands at −5.91% — DT is still an underperformer, and it has spent almost a year below the zero line, bottoming near −30 during the spring. But the trajectory has changed decisively: a week ago the reading was −9.57 (a +3.66-point improvement) and a month ago it was −15.37 (+9.46 points). In the negative zone, a rising RS line means the stock is closing the gap on the index — improvement, not yet leadership. The honest framing: DT is a laggard in repair, and deep negative RS is a standing caution even when other signals look constructive, because laggards need the market's cooperation to keep climbing. A cross above zero would upgrade this stock's standing materially; a stall here, still below zero, would leave it vulnerable if the broader market wobbles.
⑥ ATR & ADX

ADX reads 15.9 — below the 20 threshold, classifying this market as ranging rather than trending. That may seem at odds with the visible recovery, but ADX measures trend strength, not direction, and it confirms what the price bars show: the advance off the April base has come in stair-steps with long pauses, not a persistent directional drive. Practically, a low ADX environment favors buying pullbacks toward support over chasing breakouts, and it warns that momentum entries can stall quickly. ATR is $1.78 per day, about 4.02% of price — meaningful daily swing for position sizing. From the $44.41 close, the 1×ATR reference sits at $42.63 and the 2×ATR stop at $40.84; a move to the stop is roughly an 8% drawdown, which should be sized into any position from the start.
⑦ OBV

On-balance volume is in an accumulation state on both timeframes — above its 20-day average with a rising slope. On the two-year panel OBV sits well above its average (a +463.66% divergence reading), and on the 90-day panel the picture is the same in direction if smaller in degree (+72.90%). Note that the 90-day OBV level itself is still negative (−3,115,600 versus a −11,496,420 average), reflecting the heavy distribution of the spring decline that is still being worked off — the improvement is in the slope, not yet the absolute level. Taken together with the sub-average daily volume, the reading suggests quiet, persistent buying rather than aggressive institutional sponsorship. It supports the recovery thesis without proving it.
Bull Case vs Bear Case
Bull Case
- Price holds above a rising SMA60 ($40.92) and above SMA20 ($43.61), with a sequence of higher lows since the April base — recovery structure intact.
- Relative strength is improving fast: Mansfield RS rose from −15.37 a month ago to −5.91, closing in on the zero line.
- OBV is in accumulation on both the 2-year and 90-day timeframes — above its average and rising — pointing to steady net buying.
- Price trades above both anchored VWAPs ($38.49 from the Feb 9 anchor, $41.32 from May 13), so recent buyers are in profit and overhead pressure from trapped holders is reduced.
- The pullback from the July 6 high has been shallow so far, holding near the 23.6% retracement at $44.28 — the weakest form of retreat.
- No unfilled gaps remain on either timeframe, and RSI at 55.4 leaves room to run before overbought conditions appear.
Bear Case
- A fresh MACD dead cross printed on July 16 — momentum is cooling at the very moment price is testing its recovery high.
- Mansfield RS is still negative (−5.91%): DT remains an underperformer versus the S&P 500, and improving is not the same as leading.
- Volume has dried up to 0.48× the 20-day average — neither the July 6 push nor the current consolidation has been confirmed by heavy participation.
- ADX at 15.9 signals a ranging market with weak trend strength; breakout attempts in this regime are prone to stalling.
- The stock is still 20.0% below its 52-week high with a broad 2024–2025 supply zone overhead in the $50–55 area.
- The close slipped below the 5-day average ($44.81), and a 17.13% Bollinger width after expansion leaves room for a mean-reversion dip toward the mid-band at $43.61.
Scenarios
| Scenario | Probability | Path | Trigger / Invalidation |
|---|---|---|---|
| Shallow pullback resolves higher | ~45% | Price digests between the 23.6% retracement ($44.28) and SMA20 ($43.61), then reclaims the $45.52 swing high and presses toward the upper Bollinger Band near $47.35. | Trigger: a daily close above $45.52 with volume back above the 20-day average. Invalidated by a close below $42.90 (50% retracement). |
| Deeper consolidation | ~35% | The MACD dead cross extends; price works down through the 38.2–61.8% retracement band ($43.52–$42.28) toward the rising SMA60 at $40.92, then rebuilds. | Trigger: histogram deepening below −0.2 and a close under $43.61. Structure stays constructive while daily closes hold above $40.84. |
| Recovery fails | ~20% | Sellers return on rising volume; price loses the June 25 swing low at $40.28 and the negative-RS downtrend reasserts, opening a retest of the mid-$30s base. | Trigger: a daily close below the 2×ATR stop at $40.84 — that breaks the higher-low sequence and voids the recovery setup. |
Key Levels
| Price | Role | Basis |
|---|---|---|
| $47.35 | Resistance | Upper Bollinger Band (20-day) |
| $45.52 | Resistance | July 6 swing high — 0% of the up-swing (Fibonacci anchor) |
| $44.41 | Current close | July 17, 2026 |
| $44.28 | Support | 23.6% retracement of the June 25 → July 6 up-swing |
| $43.61 | Support | SMA20 / Bollinger mid-band |
| $42.90 | Support | 50% retracement of the up-swing |
| $40.84 | Stop-loss reference | 2×ATR below the close — objective invalidation (≈8% below $44.41) |
What to Watch
- Volume on any push above $45.52. A reclaim of the swing high on turnover above the 5.5M-share average would confirm the up-scenario; the same move on thin volume deserves skepticism.
- The MACD histogram over the next sessions. A flip back to positive would neutralize the July 16 dead cross; a stretch below −0.2 shifts weight to the deeper-consolidation path.
- Mansfield RS versus the zero line. A cross into positive territory would mark DT's first outperformance of the S&P 500 in nearly a year; a stall below zero keeps it in laggard territory.
- The $43.61 SMA20 / mid-band zone. Buyers stepping in there keeps the shallow-pullback reading; losing it on a closing basis targets the $42.28–$42.90 retracement band next.
- Daily closes versus $40.84. The 2×ATR stop is the line that separates a normal pullback from a failed recovery — no debate needed if it breaks.
Conclusion
Past Analyses of This Stock same ticker · newest first
This analysis is an educational interpretation of chart data and is not investment advice. Probabilities and levels are subjective estimates; every investment decision, and its outcome, is your own responsibility. Technical signals describe price behavior, not business fundamentals — always check for company-specific news and upcoming events (earnings, guidance) before acting.
Two Week Swing · twoweekswing.com · 4,600+ stocks screened weekly