Dynatrace Inc
$43.68 −22.0% from 52-week high
This analysis is based on closing-price data as of July 10, 2026. Whether you're researching how to buy Dynatrace Inc stock or you've just opened a brokerage account and are trying to time an entry, here are objective support levels and stop-loss references built from the RSI, MACD and ATR indicators.
Dynatrace has spent 2026 rebuilding from a long slide: after falling from the mid-$50s to a spring base near $31.64, the stock has climbed back to $43.68 — up +38.1% from the 52-week low but still −22.0% below the 52-week high. A June 29 MACD golden cross, on-balance volume in accumulation on both timeframes and a first pullback to the 38.2% retracement of the June–July swing frame this as a recovery under test, while Mansfield RS at −9.6% vs the S&P 500 says the market-relative repair is unfinished. The lens for the next two weeks: does this pullback hold the $42.66–$43.52 shelf, and does volume finally show up on the way back up?
Snapshot all values from the July 10, 2026 chart data
| Item | Value | Read |
|---|---|---|
| Close | $43.68 | −22.0% from 52w high / +38.1% from 52w low |
| 52-week high / low | $56.00 / $31.64 | mid-range after a deep decline and recovery |
| SMA 5 / 20 / 60 | $44.68 / $42.66 / $40.15 | uptrend stack; close sits just below SMA5 (pullback) |
| Bollinger (20, 2) | $46.65 / $42.66 / $38.68 | width 18.69%; price in the upper half, not at the band |
| aVWAP 90d | $41.08 (anchor May 13, 2026) | price above — recent buyers in profit |
| aVWAP 2y | $38.33 (anchor Feb 9, 2026) | price above — base-era buyers in profit |
| RSI (14) | 54.3 | neutral-positive; no divergence flagged |
| MACD (12, 26, 9) | 1.11 / signal 1.03 / hist +0.08 | golden cross June 29, 2026; histogram still positive |
| Mansfield RS (vs the S&P 500) | −9.6% | underperforming; +6.3 pts vs a month ago, −2.5 pts vs last week |
| ADX (14) | 16.8 | ranging / weak trend strength |
| ATR (14) | $1.88 (4.30%) | meaningful daily swing — size positions accordingly |
| OBV 2y / 90d | Accumulation / Accumulation | above MA20 and rising on both timeframes |
| Volume vs 20d avg | 0.38× | quiet tape — pullback on light volume, but rallies unconfirmed too |
| 1× / 2× ATR stop | $41.80 / $39.93 | 2× ATR stop is −8.6% below the close |
① Price & Moving Averages
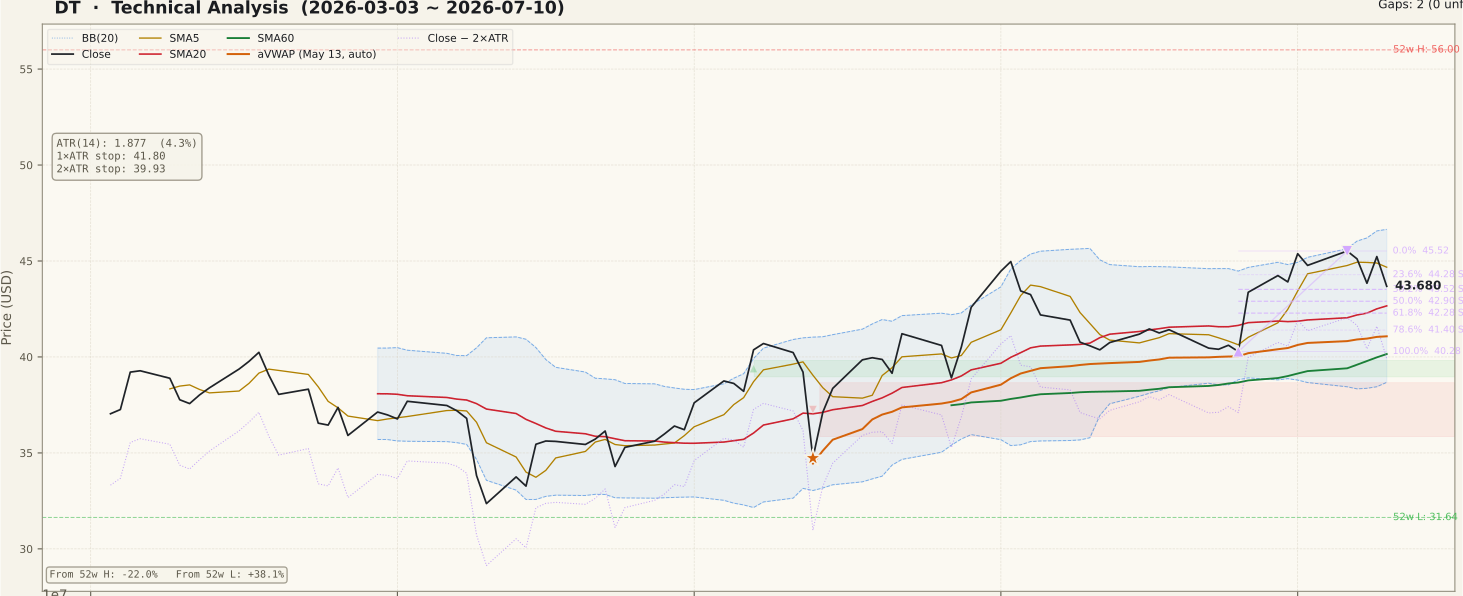
On the two-year view, DT peaked in the mid-$50s in 2025, ground lower into an early-2026 base around the $31.64 52-week low, and has been carving higher lows since April. The 90-day window shows that recovery in progress: the moving averages are stacked bullishly (SMA5 $44.68 > SMA20 $42.66 > SMA60 $40.15, all rising), and the close of $43.68 sits above the 20- and 60-day lines but has slipped below the 5-day — the signature of a short-term pullback inside an intact swing uptrend. Against the June 25 → July 6 up swing ($40.28 → $45.52), price is resting between the 23.6% retracement at $44.28 and the 38.2% at $43.52, with the 50% level at $42.90 almost exactly on the SMA20 / Bollinger mid at $42.66 — a natural shelf for this dip. Price holds above both anchored VWAPs (90d $41.08, 2y $38.33), so the average recovery-era buyer remains in profit and overhead sell pressure from trapped longs is limited below the recent high. The unfinished business is above: the whole $45–$56 zone is prior-supply territory from the 2025 decline.
② Volume

The last session printed 2,212,949 shares against a 20-day average of 5,780,707 — just 0.38× normal. Read both sides of that honestly: a pullback on shrinking volume is the constructive kind (sellers are not pressing), but the July push toward $45.52 also lacked a convincing volume signature, and a breakout without volume confirmation is the classic trap for newer traders. A handful of spike days appear earlier in the window, but the recent tape is quiet. For the bullish case to graduate from “recovery attempt” to “trend,” a push through $44.28–$45.52 needs to arrive with volume at least back to its 20-day average.
③ MACD

MACD printed a golden cross on June 29, 2026 and remains above its signal line (1.11 vs 1.03), with the histogram still positive at +0.08. Both lines sit well above the zero line, which marks this as a continuation signal inside an already-running recovery rather than an early turn off a bottom. The caveat is the histogram’s thinness: momentum is positive but narrowing as price pulls back, so a few more soft sessions could flip it negative. A histogram that re-expands from here would be the cleaner confirmation that the pullback has ended; a fresh dead cross below $42.66 would say the June thrust is being fully digested.
④ RSI

RSI(14) reads 54.3 — cooled from the upper-60s reached during the early-July push, but holding the >50 zone that typically characterizes pullbacks within uptrends. No bullish or bearish divergence is flagged in the data. The practical read: RSI has reset without breaking structure, leaving room to run if buyers return, and there is no overbought excuse (>70) to fade the stock here. Watch the 50 line — recoveries that keep RSI above it on dips tend to resolve higher, while a slide into the low-40s would align with the deeper-consolidation scenario below.
⑤ Mansfield Relative Strength

Mansfield RS vs the S&P 500 stands at −9.6% — DT is still an underperformer, and that single fact caps how aggressive any bullish read should be. The direction of travel is the encouraging part: a month ago the reading was −15.9%, so relative strength has improved by about +6.3 points, and the line’s slope is rising. Note, however, that last week’s reading was −7.1%, meaning the past week gave back about 2.5 points — the repair is real but not yet steady. Deeply negative RS is a warning even when price signals look bullish: until this line crosses above zero, DT is a recovering laggard, not a leader, and market-wide weakness would likely hit it harder than average.
⑥ ATR & ADX

ATR(14) is $1.88, or 4.30% of price — a stock that routinely moves several percent a day, which argues for smaller position sizes and wider stops than a slow large-cap would need. ADX at 16.8 sits below the 20 threshold: technically this is still a ranging tape, not an established trend. Remember ADX measures trend strength, not direction — a low reading here says the June advance has not yet matured into a persistent trend, so chasing strength is lower-odds than buying tested support. The objective risk anchors: $41.80 (1× ATR) and $39.93 (2× ATR, −8.6%) below the close.
⑦ OBV (On-Balance Volume)

OBV is the strongest card in DT’s hand. On both the two-year and 90-day windows the state is accumulation: OBV sits above its 20-day average with a rising slope, and the gap between OBV and its average is wide (divergence reading +190.4% on 2y, +173.9% on 90d — inflated partly by the average hovering near zero, so treat the direction as the signal rather than the magnitude). Volume flow has led price through the recovery rather than lagged it — the opposite of the “price up, OBV flat” non-confirmation that undermines many bounces. If OBV holds above its average through this pullback, it supports the case that dips are being bought.
Bull Case vs Bear Case
Bull Case
- MACD golden cross (June 29) with both lines above zero — momentum is positive inside an existing recovery.
- OBV in accumulation on both 2y and 90d windows — volume flow confirms the advance.
- Bullish MA stack (SMA5 > SMA20 > SMA60, all rising) with price above both anchored VWAPs.
- Mansfield RS repaired by +6.3 points over the past month with a rising slope.
- Higher-low structure since the April base; the current dip has only reached the 38.2% retracement ($43.52).
- 50% retracement ($42.90) and SMA20 / Bollinger mid ($42.66) form a tight support shelf just below price.
Bear Case
- Mansfield RS is still −9.6% — a confirmed underperformer until the zero line is reclaimed.
- RS gave back 2.5 points versus last week — the relative repair is not yet steady.
- Volume at 0.38× the 20-day average — neither the July rally nor any breakout is volume-confirmed.
- ADX 16.8 — a ranging market; trend-followers have no established trend to lean on.
- Price is still 22.0% below the 52-week high with heavy prior supply across $45–$56.
- 4.30% daily ATR puts the 2× ATR stop 8.6% away — the position risk per share is substantial.
Scenarios
| Scenario | Probability | Path | Trigger / Invalidation |
|---|---|---|---|
| Pullback resolves higher | ~45% | Dip holds the $42.66–$43.52 shelf, then price retakes $44.28 and retests the $45.52 swing high; next objective the upper band at $46.65. | Trigger: close above $44.28 with volume ≥ 1× the 20-day average. Invalidation: a close below $42.28 (61.8% retracement). |
| Deeper consolidation | ~35% | SMA20 gives way and price digests the June advance across $41.08–$42.28 (78.6% retracement, 90d aVWAP) while RS stays negative. | Trigger: close below $42.28 on expanding volume. Invalidation of this path: quick reclaim of $43.52. |
| Failed recovery | ~20% | Sellers press through the $40.28 swing low and the $39.93 stop; the stock returns to its spring base and the swing thesis is wrong. | Trigger: close below $40.28. The 2× ATR stop at $39.93 is the hard exit reference. |
Key Levels
| Price | Role | Basis |
|---|---|---|
| $46.65 | Resistance | Upper Bollinger band (20, 2) |
| $45.52 | Resistance | July 6 swing high — 0% of the June 25 → July 6 swing |
| $44.28 | Support | 23.6% retracement of the same swing |
| $43.68 | Current | July 10, 2026 close |
| $43.52 | Support | 38.2% retracement — the line this pullback is testing |
| $42.66 | Support | SMA20 / Bollinger mid; 50% retracement sits at $42.90 just above |
| $41.08 | Support | 90-day anchored VWAP (May 13 anchor); 78.6% retracement $41.40 nearby |
| $39.93 | Stop-loss | 2× ATR below the close (−8.6%); also under the $40.28 swing low |
What to Watch
- Volume on any push above $44.28–$45.52 — a breakout at 0.38× average volume is not trustworthy; demand ≥ 1× the 20-day average.
- The $42.66–$42.90 shelf (SMA20 / 50% retracement) — the line between a routine dip and a deeper digestion.
- Mansfield RS versus the zero line — a cross above zero would upgrade DT from recovering laggard to genuine outperformer.
- MACD histogram — re-expansion confirms the pullback ended; a dead cross warns of a longer pause.
- OBV vs its 20-day average — accumulation persisting through the dip is the bull case’s backbone.
Conclusion
Past Analyses of This Stock same ticker · newest first
This analysis is an educational interpretation of chart data and is not investment advice. Probabilities and levels are subjective estimates; every investment decision, and its outcome, is your own responsibility. Indicator values are taken from closing-price data as of July 10, 2026 and are not recalculated intraday. If a stock moves sharply on news, earnings or other fundamental catalysts, do not act on technical signals alone — check the catalyst first.
Two Week Swing · twoweekswing.com · 4,600+ stocks screened weekly