Zevra Therapeutics, Inc.
This analysis is based on closing-price data as of July 10, 2026. Whether you're researching how to buy Zevra Therapeutics stock or you've just opened a brokerage account and are trying to time an entry, here are objective support levels and stop-loss references built from the RSI, MACD and ATR indicators.
Zevra Therapeutics has climbed 86.5% off its 52-week low of $7.16 and spent the last three months in a stair-step uptrend that accelerated into a July 8 swing high at $14.75, about 1.9% below the 52-week high of $15.03. The stock still outperforms the Nasdaq Composite (Mansfield RS +18.2%) with a strong ADX-34 trend and on-balance volume in accumulation, but a MACD dead cross printed on July 10 and price has already pulled back through the 61.8% retracement of the June-July swing. The near-term question is whether the $13.02–$12.55 support band holds while the trend digests its gains.
Snapshot all values from the July 10, 2026 chart data
| Close | $13.35 | 52-week high / low | $15.03 (-11.2%) / $7.16 (+86.5%) |
|---|---|---|---|
| SMA5 / SMA20 / SMA60 | $14.09 / $13.42 / $11.68 | Bollinger (20) | $12.04 – $14.80, mid $13.42, width 20.57% |
| aVWAP (2y) | $10.10 (anchor Aug 13, 2025) | aVWAP (90d) | $13.48 (anchor Jun 9, 2026) |
| RSI (14) | 52.7 — neutral | Mansfield RS (vs Nasdaq Composite) | +18.16% — outperform, flat slope |
| MACD (12,26,9) | 0.63 vs signal 0.69, histogram -0.06 — dead cross Jul 10, 2026 | ADX (14) | 34.1 — strong trend |
| ATR (14) | $0.75 (5.61% of price) | Volume vs 20-day avg | 1.24x (2,048,201 vs 1,647,495) |
| OBV (2y) | Accumulation — above rising 20-day MA, +8.56% | OBV (90d) | Accumulation — above rising 20-day MA, +25.93% |
| 1×ATR stop | $12.60 | 2×ATR stop | $11.85 |
① Price & Moving Averages
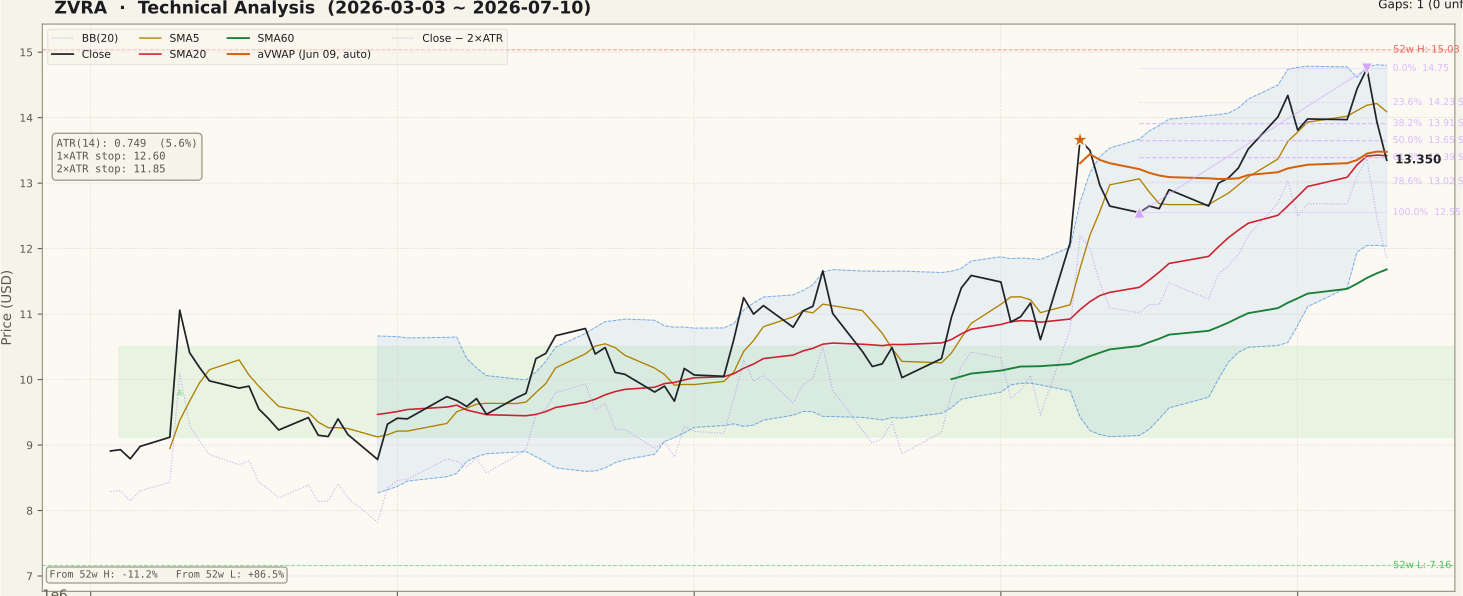
The 90-day chart shows a persistent stair-step advance from the high $8s in early March to the $14.75 swing high on July 8, riding the upper half of the Bollinger Bands for most of June. The two-year picture adds context: ZVRA spent roughly a year basing between $8 and $12 before this spring's breakout, and price now sits well above the rising SMA60 at $11.68 and far above the two-year anchored VWAP at $10.10, meaning the average buyer since the August 2025 anchor is comfortably in profit. The last two sessions, however, turned the short-term tape defensive: the close of $13.35 is below the SMA5 ($14.09) and marginally below the SMA20 / Bollinger midline at $13.42. Measured against the June 15 to July 8 swing ($12.55 to $14.75), price has already retraced past the 61.8% level at $13.39, with the 78.6% level at $13.02 and the swing low at $12.55 as the next supports. A pullback after a strong leg is normal; a pullback that cannot hold the bottom of that band is not.
② Volume

The latest session traded 2,048,201 shares, about 1.24x the 20-day average of 1,647,495 — modestly elevated, and notable because it accompanied a down day. Volume expanded on the early-June breakout and again into the July push, which is the healthy pattern for an advance, but the recent red bars carrying slightly above-average volume show sellers are taking profits into strength rather than quietly stepping aside. With average dollar volume above $20 million a day, liquidity is adequate for a mid-cap biotech, though the 5.6% daily ATR means fills can still slip in fast tape. Watch whether any bounce off the $13.02–$12.55 zone attracts at least average volume — a low-volume bounce would be easier for sellers to reverse.
③ MACD

MACD printed a dead cross on July 10, 2026 — the same date as this analysis — with the MACD line at 0.63 slipping under the signal at 0.69 and the histogram turning slightly negative at -0.06. Two things keep this from being an automatic sell signal. First, both lines remain well above zero, so the cross marks a loss of upside momentum within an uptrend, not a trend reversal. Second, the histogram is barely negative; a one- or two-day rebound could re-cross it. That said, dead crosses that appear right after a swing high, as this one does, often precede a few weeks of sideways-to-lower digestion. Treat momentum as neutral-to-soft until the histogram turns green again or price reclaims the 20-day average.
④ RSI

RSI(14) sits at 52.7, almost exactly neutral. Through the 90-day uptrend RSI repeatedly tagged the high 60s and briefly pierced 70, then reset toward 50 on each pullback without ever reaching oversold — the classic footprint of a trending stock where the 40–50 zone acts as the momentum floor. The current reading is another such reset. No divergence was flagged in the data at the July high, so there is no bearish non-confirmation to lean on, but neither is there an oversold extreme to fade. In a trend-following framework, an RSI hold above roughly 45 on this pullback would keep the bullish rhythm intact, while a slide into the 30s would signal the character of the tape has changed.
⑤ Mansfield Relative Strength

Mansfield RS versus the Nasdaq Composite stands at +18.16% — ZVRA has been a clear market outperformer, and it only crossed decisively above the zero line in mid-June. The internals, however, show cooling: a week ago RS was 25.99 and a month ago 25.72, so the weekly change is -7.8 points and the monthly change -7.6 points. In the positive zone a negative change reads as slowing outperformance — the stock is still beating the index, but by a shrinking margin as it pulls back. That is consistent with a digestion phase rather than distribution, provided RS holds above zero. A drop of the RS line back below zero would remove one of the strongest pillars of this setup.
⑥ ATR & ADX volatility & trend strength

ADX(14) reads 34.1 — a strong trend by the usual >25 threshold. Remember ADX measures trend strength, not direction; here it has been rising alongside an advancing price, which is the constructive combination. ATR(14) is $0.75, or 5.61% of the close — wide daily ranges typical of a small/mid-cap biotech, and the ATR has expanded through June and July as the move accelerated. Practically, that volatility dictates position sizing: the 1×ATR reference sits at $12.60 and the 2×ATR stop at $11.85, roughly 11.2% below the close. A stop tighter than one ATR is likely to be hit by ordinary noise in a name that moves 5–6% a day.
⑦ OBV on-balance volume

OBV is in accumulation on both timeframes — above a rising 20-day OBV average by +8.56% on the two-year window and by +25.93% on the 90-day window. The two-year OBV line has been in a steady uptrend since late 2025, and the 90-day line pushed to new highs alongside price into July, so there is no bearish volume divergence at the recent peak. This is the strongest counterweight to the MACD dead cross: sellers have taken some profit, but cumulative volume flow says buyers have absorbed supply throughout the advance. If OBV were to slip below its 20-day average during this pullback, that would be an early warning worth respecting.
Bull Case vs Bear Case
Bull Case
- Mansfield RS +18.2% vs the Nasdaq Composite — a genuine market outperformer.
- ADX 34 confirms a strong, established uptrend rather than a one-day pop.
- OBV in accumulation on both windows (90d: +25.9% above a rising average) — no volume divergence at the highs.
- Price holds far above the rising SMA60 ($11.68) and 32% above the 2-year aVWAP ($10.10).
- No unfilled overhead gaps on the 2-year chart — little trapped-supply resistance below the 52-week high.
- Orderly pullback so far: RSI reset to ~50, the classic trend-continuation zone.
Bear Case
- Fresh MACD dead cross printed July 10, right after the swing high.
- RS is slowing: -7.8 points week over week — the outperformance margin is shrinking.
- Close below the SMA5 and marginally below the SMA20/Bollinger midline ($13.42).
- Price is back under the 90-day aVWAP ($13.48) — recent swing buyers are, on average, underwater.
- Pullback has already cut through the 61.8% retracement ($13.39) of the June-July swing — deeper than a shallow dip.
- ATR at 5.6% of price: wide daily swings can turn a normal stop into a large loss if oversized.
Scenarios
| Scenario | Probability | Path | Trigger / Invalidation |
|---|---|---|---|
| Pullback holds, retest of highs | ~45% | Price stabilizes in the $13.02–$12.55 support band, reclaims the SMA20 at $13.42, then retests $14.75 and the 52-week high at $15.03. | Trigger: daily close back above $13.42 on at least average volume. Invalidation: daily close below $12.55. |
| Sideways digestion | ~35% | Several weeks of range-trading between roughly $12.55 and $14.75 while the MACD resets and RS cools; trend resumes only after a base forms. | Trigger: repeated failures under $14.09 (SMA5) with support holding above $12.55. |
| Deeper correction | ~20% | Loss of $12.55 opens the 2×ATR stop zone at $11.85 and the rising SMA60 at $11.68; below that, the two-year aVWAP near $10.10 is the deeper magnet. | Trigger: daily close below $12.55 on above-average volume. The bullish swing setup is invalidated below $11.85. |
Probabilities are subjective estimates based on the chart evidence above, not forecasts.
Key Levels
| Price | Role | Basis |
|---|---|---|
| $14.75 | Resistance | July 8 swing high — 0% of the June-July swing (52-week high $15.03 just above) |
| $14.09 | Resistance | SMA5 — first hurdle for any bounce |
| $13.42 | Resistance / pivot | SMA20 and Bollinger midline; also ~61.8% retracement at $13.39 |
| $13.35 | Current close | July 10, 2026 |
| $13.02 | Support | 78.6% retracement of the June-July swing |
| $12.55 | Support | June 15 swing low — 100% retracement; 1×ATR stop $12.60 sits here |
| $11.85 | Stop-loss reference | 2×ATR stop — objective invalidation of the swing setup (-11.2% from close) |
What to Watch
- Whether the SMA20 at $13.42 is reclaimed quickly — a fast reclaim would neutralize the dead cross.
- Volume on any bounce from $13.02–$12.55: at least the 20-day average (~1.65M shares) is needed for conviction.
- The weekly Mansfield RS change — a second consecutive week of decline toward the zero line would downgrade the setup.
- The MACD histogram: a flip back to green above the zero line would mark the pullback as complete; a widening red histogram would not.
- OBV versus its 20-day average — accumulation is the bull case's backbone; losing it removes the thesis's strongest support.
Conclusion
Past Analyses of This Stock same ticker · newest first
This analysis is an educational interpretation of chart data and is not investment advice. Probabilities and levels are subjective estimates; every investment decision, and its outcome, is your own responsibility. Zevra Therapeutics is a biotech company — clinical and regulatory news can move the stock far beyond any technical level. If a stock has just made an outsized news-driven move, technical signals alone are not a sufficient basis to act — check the fundamental catalyst first.
Two Week Swing · twoweekswing.com · 4,600+ stocks screened weekly