WD-40 Company
$264.91 −11.4% from 52-week high · +51.0% above 52-week low
This analysis is based on closing-price data as of July 10, 2026. Whether you're researching how to buy WD-40 Company stock or you've just opened a brokerage account and are trying to time an entry, here are objective support levels and stop-loss references built from the RSI, MACD and ATR indicators.
After a year-long slide from the $298.90 fifty-two-week high down to $175.38, WDFC has spent 2026 rebuilding — and on July 10 it detonated: a gap-up from the $247.34 area to a $264.91 close on 5.24x average volume, the largest volume bar on the two-year chart. Relative strength has just crossed into positive territory versus the Nasdaq Composite and MACD printed a fresh golden cross. The tension in this chart is that the very same session also locked in a bearish RSI divergence and left price stretched above its upper Bollinger Band. A one-day repricing of this size is usually news-driven, so the technicals should be read as reaction to a catalyst, not in isolation.
Snapshot all values from chart JSON, July 10, 2026
| Item | Value | Reading |
|---|---|---|
| Close | $264.91 | −11.4% from 52w high, +51.0% above 52w low |
| 52-week high / low | $298.90 / $175.38 | upper part of the yearly range |
| SMA 5 / 20 / 60 | $249.40 / $238.31 / $218.45 | bullish stack, close far above all three |
| Bollinger (upper / mid / lower) | $261.88 / $238.31 / $214.74 | close sits above the upper band — stretched (width 19.78%) |
| aVWAP 90d (anchor Apr 10, 2026) | $223.45 | price well above — recent buyers in profit |
| aVWAP 2y (anchor Jan 9, 2026) | $221.92 | long-term anchor also well below price |
| RSI(14) | 73.17 | overbought, with a bearish divergence vs the June 16 peak |
| Mansfield RS vs the Nasdaq Composite | +9.66% | outperforming and accelerating (prev week +3.16, prev month −5.96) |
| MACD (12,26,9) | 9.92 / 9.00 / +0.92 | golden cross printed July 10 |
| ADX(14) | 34.90 | strong trend strength |
| ATR(14) | $10.46 (3.95%) | volatility jumped with the gap |
| OBV | 2y: accumulation / 90d: accumulation | above MA20 and rising on both frames |
| Volume vs 20-day avg | 5.24x | 1,165,340 shares vs a 222,277 average — institutional-scale participation |
| ATR stops (1x / 2x) | $254.45 / $243.99 | objective invalidation references |
① Price & Moving Averages
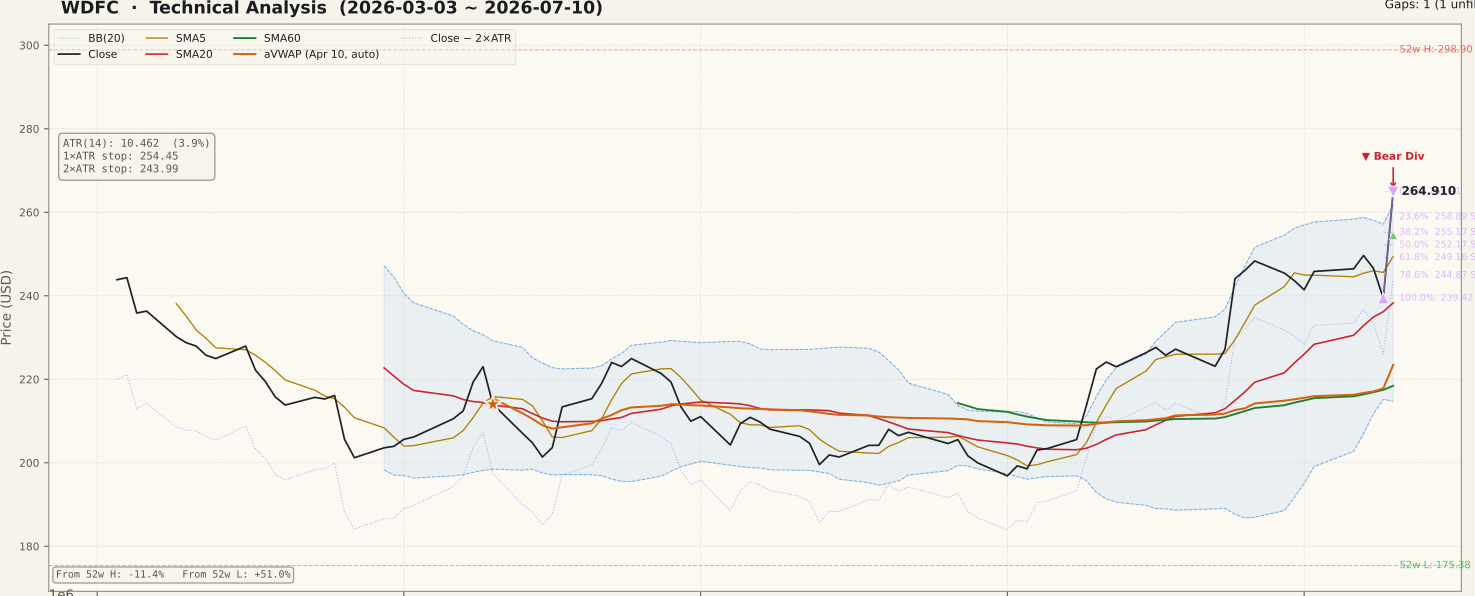
The 90-day chart shows a rounded base through April–June that resolved sharply higher: close $264.91 stands above SMA5 ($249.40), SMA20 ($238.31) and SMA60 ($218.45), a fully bullish alignment with the close a wide 11% above even the 5-day average after the July 10 gap. That gap — $247.34 to $261.49 — is unfilled and now defines the key support zone below. Price closed above the upper Bollinger Band ($261.88), which strong breakouts can do briefly, but it is a statistically stretched condition that more often resolves with a pause or partial retracement than immediate follow-through. Note the Fibonacci grid here spans only the July 9–10 thrust ($239.42 to $264.91), so its retracement levels mark untested intraday shelves rather than battle-hardened support. On the two-year frame, the next meaningful overhead reference is the 52-week high at $298.90 from late 2024.
② Volume

Volume is the headline: 1,165,340 shares traded against a 20-day average of 222,277 — a 5.24x surge that dwarfs every other bar on the two-year chart. Moves confirmed by volume of this magnitude are the opposite of the low-volume breakouts that trap beginners; someone with size was willing to pay up aggressively. The flip side is that a one-day, gap-driven volume event of this scale almost always has a fundamental cause — an earnings report or similar catalyst — and the durability of the move depends on what that news actually was, not on the bar itself. Confirm the catalyst before extrapolating the volume signal.
③ MACD

MACD (9.92) crossed back above its signal line (9.00) on July 10 itself, with the histogram flipping to +0.92. The context matters: MACD had been easing off since early July as price consolidated the June advance, and the gap snapped it back into a golden cross high above the zero line — a continuation signal within an established uptrend rather than an early turn. Because this cross was manufactured by a single outsized session, treat it as provisional until a few more closes confirm that momentum is genuinely re-expanding rather than spiking.
④ RSI

RSI(14) closed at 73.17, in overbought territory, and the data flags a bearish divergence: on June 16 price was $227.64 with RSI at 76.33, while the July 10 close of $264.91 — over $37 higher — registered a lower RSI of 73.17. Momentum per unit of price gain is fading even as price accelerates, a classic late-stage caution flag. Two beginner traps to avoid here: first, a divergence is a possibility of reversal, not a confirmed top — it needs a price break (for instance, losing the gap zone) to validate. Second, overbought RSI in a strong-volume breakout can stay pinned for a while. The honest read is elevated risk, not an automatic sell.
⑤ Mansfield Relative Strength

Mansfield RS vs the Nasdaq Composite reads +9.66% — WDFC has crossed from laggard to leader. A week ago the reading was +3.16 (a +6.51-point acceleration) and a month ago it was −5.96, meaning the stock has swung more than 15 points against the index in a month. This zero-line crossover is one of the most constructive items on the whole chart: in the Mansfield framework, sustained moves tend to come from names that establish and hold positive relative strength. What would spoil it is a quick relapse below zero, which would tag the July 10 session as a one-off event rather than a leadership change.
⑥ ATR & ADX

ADX at 34.90 signals a strong, well-established trend, and it has been elevated through the entire June–July advance — this is not a drift higher. ATR spiked to $10.46 (3.95% of price) with the gap, roughly a percentage point of daily range added overnight. Wider ATR means wider stops: the 1x ATR reference sits at $254.45 and the 2x ATR stop at $243.99, about 7.9% below the close and — usefully — just below the $247.34 gap bottom, so the mechanical stop and the structural level roughly agree. Position size should be set from that 7.9% distance, not from hope that the gap holds.
⑦ OBV (On-Balance Volume)

OBV is in accumulation on both timeframes — above its 20-day average and rising — and the July 10 session pushed the 90-day OBV (1,659,940) to more than triple its average (517,522), a 220.75% divergence gap that quantifies just how one-sided the buying was. The two-year OBV tells the same story (3,461,440 vs a 2,319,022 average). Unlike the RSI panel, there is no negative signal here: cumulative volume flow made new highs together with price, which argues the gap was driven by real demand rather than short-covering froth.
Bull Case vs Bear Case
Bull Case
- Gap-up on 5.24x average volume — the heaviest participation on the two-year chart
- Mansfield RS crossed positive (+9.66%) and is accelerating: +6.51 pts in a week
- Fresh MACD golden cross high above the zero line — trend continuation profile
- OBV at new highs with price, in accumulation on both 2y and 90d frames
- Bullish SMA stack with a rising SMA60 — the base-building phase resolved upward
- ADX 34.90 confirms a strong trend, and both anchored VWAPs sit far below price
Bear Case
- Bearish RSI divergence locked in: $227.64 / RSI 76.33 (Jun 16) vs $264.91 / RSI 73.17 (Jul 10)
- Close above the upper Bollinger Band — statistically stretched short term
- A wide unfilled gap ($247.34–$261.49) invites a gap-fill attempt
- One-day repricing is almost certainly catalyst-driven — technicals alone can't validate it
- The one-day Fibonacci swing means every nearby support level is untested
- Still 11.4% below the $298.90 52-week high, where 2024 buyers are trapped
Scenarios
| Scenario | Probability | Path | Trigger / Invalidation |
|---|---|---|---|
| Digest, partially fill, resume | ~40% | Cools off into the $258.89–$252.17 retracement band or the upper gap zone, resets RSI below 70, then resumes toward the highs. | Trigger: quiet pullback on shrinking volume that holds above $247.34. Constructive while the gap bottom holds. |
| Gap-and-go continuation | ~35% | Holds above $258.89–$261.49 and momentum carries the advance toward the 52-week high at $298.90. | Trigger: closes holding above $261.49 with follow-through volume. Invalidated by a close back inside the lower half of the gap. |
| Full gap fill / failed breakout | ~25% | The RSI divergence asserts itself, price closes the entire gap to $247.34 and keeps sliding toward the SMA20 near $238.31. | Trigger: daily close below the gap bottom $247.34; a close below the 2x ATR stop at $243.99 negates the move entirely. |
Key Levels
| Price | Role | Basis |
|---|---|---|
| $298.90 | Resistance | 52-week high — major overhead supply |
| $264.91 | Current | Close, July 10, 2026 (swing high / Fibonacci 0%) |
| $261.88 / $261.49 | Support | Bollinger upper band + top of the unfilled July 10 gap |
| $258.89 | Support | Fibonacci 23.6% retracement of the July 9–10 thrust |
| $255.17 | Support | Fibonacci 38.2% retracement |
| $252.17 | Support | Fibonacci 50% retracement (near the 1x ATR reference $254.45) |
| $243.99 | Stop-loss | 2x ATR below close — just under the $247.34 gap bottom |
What to Watch
- The catalyst itself: identify what news drove a 5.24x-volume gap before acting — the chart cannot tell you whether the repricing was a guidance change or a one-off item.
- Whether closes hold above the $261.49 gap top: acceptance above it keeps the gap-and-go path alive; a slip back inside the gap starts the fill scenario.
- The $247.34 gap bottom — the structural line between healthy digestion and a failed breakout, with the mechanical 2x ATR stop just below at $243.99.
- RSI behavior on the next push higher: a new RSI high above 76.33 would cancel the bearish divergence; another lower high would deepen it.
- Mansfield RS holding above zero — relapse below would demote July 10 to a one-day event.
Conclusion
Past Analyses of This Stock same ticker · newest first
This analysis is an educational interpretation of chart data and is not investment advice. Probabilities and levels are subjective estimates; every investment decision, and its outcome, is your own responsibility. When a stock repriced on likely fundamental news, technical signals alone are not a sufficient basis to buy. All figures are derived from closing-price data as of July 10, 2026 and may be outdated by the time you read this.
Two Week Swing · twoweekswing.com · 4,600+ stocks screened weekly