Venture Global, Inc.
$14.31 −18.8% from 52-week high $17.62
This analysis is based on closing-price data as of July 24, 2026. Whether you're researching how to buy Venture Global, Inc. stock or you've just opened a brokerage account and are trying to time an entry, here are objective support levels and stop-loss references built from the RSI, MACD and ATR indicators.
Venture Global has spent its first two years as a public stock in violent, wide swings — from a 52-week low of $5.72 to a high of $17.62, and it now sits +150.2% above that low but still −18.8% below the high. The last three weeks turned constructive: a MACD golden cross on July 7, a confirmed bullish RSI divergence at the $10.85 July low, and Mansfield relative strength flipping from deeply negative to +17.4% versus the S&P 500. The immediate obstacle is just overhead — an unfilled gap between $14.61 and $15.65 from April 8 — so this is an early-stage recovery pressing into known supply, not an open runway.
Snapshot all values from the July 24, 2026 close
| Item | Value | Read |
|---|---|---|
| Close | $14.31 | −18.8% from 52w high, +150.2% from 52w low |
| 52-week high / low | $17.62 / $5.72 | Very wide first-year range |
| SMA 5 / 20 / 60 | $14.53 / $12.68 / $12.61 | Above SMA20 & SMA60; a hair below SMA5 after Thursday's push |
| Bollinger (20) | $15.50 / $12.68 / $9.86 | Band width 44.41% — volatility still elevated |
| aVWAP (2y anchor Mar 6, 2025) | $11.89 | Price above — long-term holders in profit |
| aVWAP (90d anchor May 12, 2026) | $12.85 | Price above — recent buyers in profit |
| RSI (14) | 61.0 | Bullish divergence (Jun 9 → Jul 6), rising, not yet overbought |
| Mansfield RS (vs S&P 500) | +17.4% | Outperforming, rising; +5.5 pts vs last week |
| MACD (12,26,9) | 0.70 / 0.41 / +0.29 | Golden cross Jul 7; histogram expanding |
| ADX (14) | 23.6 | Emerging trend — not yet a confirmed strong trend (>25) |
| ATR (14) | $0.75 (5.21%) | High daily volatility for position sizing |
| OBV (2y / 90d) | Accumulation / Accumulation | Both above MA20, rising; divergence +39.51% / +23.18% |
| Volume vs 20-day avg | 1.31× (19,425,700 vs 14,868,135) | Above-average participation on the advance |
| ATR stops (1× / 2×) | $13.56 / $12.82 | Objective invalidation references |
① Price & Moving Averages
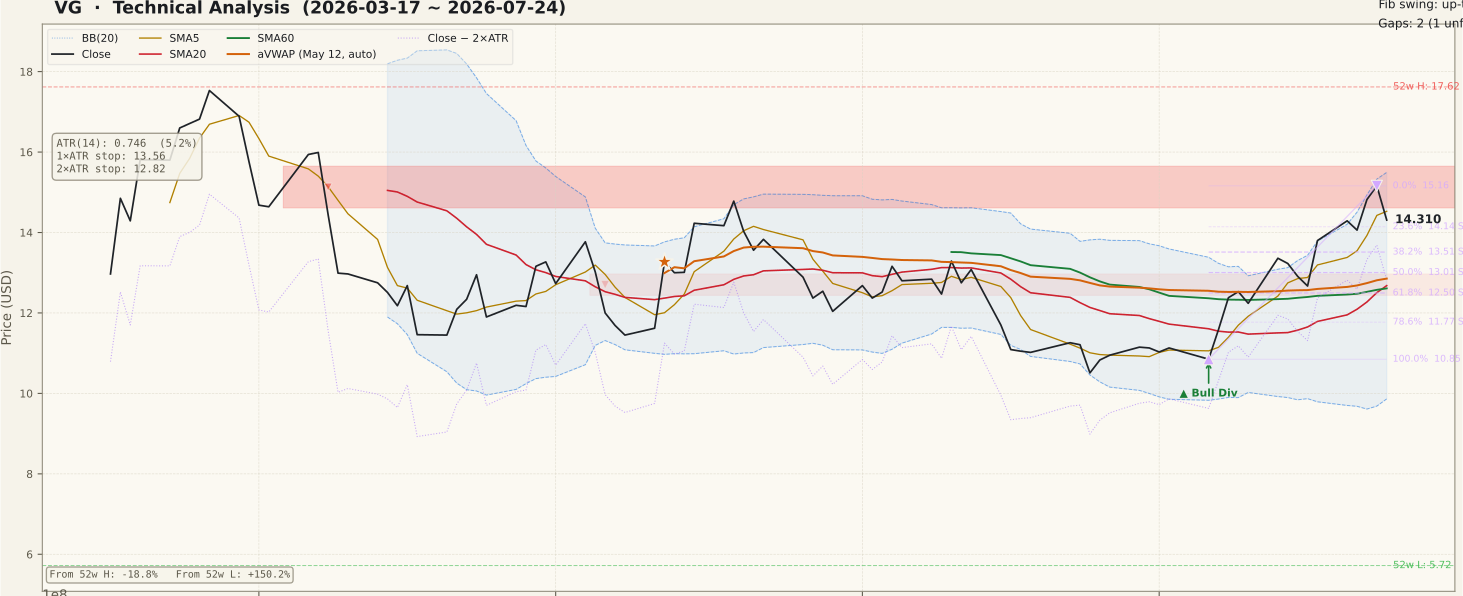
On the two-year view, VG is a stock of big round trips: a post-IPO collapse in early 2025, a summer 2025 recovery to the $17 area, a slide to the $5.72 December low, and a sharp 2026 rebound that stalled at $17.53 in late March. The 90-day window shows the latest leg: a decline into the $10.85 low on July 6, followed by a fast recovery to Thursday's $15.16 swing high and a Friday close at $14.31. Price is back above both the 20-day ($12.68) and 60-day ($12.61) averages — which have converged almost exactly, a base-building signature — though the close slipped just under the 5-day average ($14.53) as Friday faded from the high. The stock also trades above both anchored VWAPs ($12.85 on the 90-day anchor, $11.89 on the two-year anchor), meaning the average buyer over both horizons is in profit and overhead sell-pressure from trapped holders is reduced. The caution flag: the recent swing's Fibonacci retracements put first support at $14.14 (23.6%) and $13.51 (38.2%), while the unfilled April 8 gap at $14.61–$15.65 sits directly on top of the current price.
② Volume

Friday printed 19,425,700 shares against a 20-day average of 14,868,135 — a 1.31× ratio, so the advance is drawing above-average participation rather than drifting up on thin trade. That matters because the most common beginner trap in a setup like this is trusting a breakout that volume never confirmed. The 90-day panel shows the heaviest bars clustered in the March–April sell-off, while the July recovery has run on steadily building, mostly green volume — adequate, but not yet the kind of 2×+ spike that typically powers a clean gap-fill breakout. Watch for expansion, not contraction, if price presses into the $14.61–$15.65 gap zone.
③ MACD

MACD delivered a golden cross on July 7 — one session after the price low — from below the zero line, which is where the more durable crosses tend to originate. Since then the MACD line (0.70) has pulled clearly above the signal (0.41) and crossed into positive territory, with the histogram expanding to +0.29. The two-year panel tells the same story at larger scale: momentum has cycled from the deeply negative readings of the spring decline back to positive. The main thing to monitor now is histogram deceleration — after a near-vertical three-week rally, a shrinking histogram near the gap resistance would be the first early warning that this momentum leg is tiring.
④ RSI

The July low came with a textbook bullish divergence: price made a lower low from $12.47 on June 9 to $10.85 on July 6, while RSI made a higher low (38.4 → 40.0 on the 90-day calculation). Divergence alone is only a possibility of reversal — but this one has already been confirmed by the follow-through rally, which is what separates it from the many divergences that simply fail. RSI now reads 61.0: firmly in bullish territory, above the 50 midline, but closing in on the 70 overbought threshold. On the two-year panel, VG's prior rallies (June 2025, March 2026) pushed RSI through 70 before topping, so an overbought print by itself would not end the move — it would, however, argue against chasing an extended entry.
⑤ Mansfield Relative Strength

Mansfield RS vs the S&P 500 stands at +17.4% — VG is outperforming the broad market, and the line is rising. The trajectory is the notable part: a week ago the reading was +11.9 (a gain of +5.5 points, positive and accelerating), and a month ago it was −14.1 — a swing of more than 31 points from laggard to leader in four weeks. Zero-line crossings from below are the classic Mansfield tell that institutional money is rotating in, and this one is recent, so the outperformance streak is young rather than mature. The caveat is symmetry: RS lines that flip this fast can flip back; a drop back below zero would remove one of the strongest planks of the bull case.
⑥ ATR & ADX

ATR is $0.75, or 5.21% of price — this stock routinely moves in a day what many large caps move in a week, so position sizing should be scaled to that reality rather than to a fixed dollar stop. ADX at 23.6 sits in the “emerging” band: trend strength is building from the sub-20 chop of June but has not yet cleared 25, the conventional threshold for a confirmed strong trend. Remember that ADX measures strength, not direction — a rising ADX here would validate the up-move only because price and the other panels point up. The ATR-derived references are $13.56 (1× below close) and $12.82 (2×), the latter serving as this analysis's objective invalidation level.
⑦ OBV (On-Balance Volume)

OBV is in an accumulation state on both timeframes — above its 20-day average and rising, with a divergence reading of +39.51% on the two-year window and +23.18% on the 90-day window — so cumulative volume flow supports the price recovery rather than contradicting it. The 90-day panel also carries its own bullish OBV divergence marker at the July low, echoing the RSI signal. The honest qualifier: on the longer view, OBV's absolute level remains below where it started the year, meaning the heavy distribution of the March–April decline has been only partially repaired. Accumulation is real but young — a fresh OBV high alongside a gap-fill breakout would be the stronger confirmation.
Bull Case vs Bear Case
Bull Case
- MACD golden cross (Jul 7) from below zero, now positive with an expanding histogram
- Confirmed bullish RSI divergence at the $10.85 low (Jun 9 → Jul 6), already resolved upward
- Mansfield RS +17.4% vs the S&P 500 — positive and accelerating (+5.5 pts in a week, +31 pts in a month)
- OBV accumulation on both 2y and 90d frames — volume flow confirms the rally
- Price above SMA20, SMA60 and both anchored VWAPs — average buyers in profit, converged MAs forming a base
- Friday's advance came on 1.31× average volume, not thin trade
Bear Case
- Unfilled April 8 gap at $14.61–$15.65 sits directly overhead — known supply zone
- Still −18.8% below the 52-week high, with the $17.53 March swing high as major resistance
- Friday closed below the 5-day average after fading from the $15.16 high — short-term momentum pausing
- ADX 23.6 has not confirmed a strong trend; the recovery is only three weeks old
- ATR 5.21% of price and Bollinger width 44% — volatility high enough to shake out tight stops
- Long-view OBV still below its early-year level — prior distribution not fully absorbed
Scenarios
| Scenario | Probability | Path | Trigger / Invalidation |
|---|---|---|---|
| Gap fill & continuation | ~45% | Price digests near $14, then pushes through the $14.61–$15.65 gap toward the 2y 23.6% retracement at $15.59 and eventually the $17.53 swing high. | Trigger: daily close above $15.16 on ≥1.5× average volume. Invalidated by rejection at the gap with a close back under $13.51. |
| Pullback & base | ~35% | Rejection at the gap zone leads to a controlled pullback into $14.14 / $13.51 retracement support; the base builds above the converged SMA20/60 near $12.6–$12.7. | Trigger: fade at $14.61–$15.65 on shrinking volume. Turns bullish again on a higher low above $13.51; turns bearish below $12.82. |
| Failed recovery | ~20% | Momentum stalls, the divergence rally unwinds, and price breaks back below the moving-average cluster toward $12.50 (61.8%), then $11.77 (78.6%) and the $10.94–$9.78 support gap. | Trigger: daily close below the 2×ATR stop at $12.82, which would also put price back under both aVWAPs and the SMA20/60 cluster. |
Key Levels
| Level | Role | Basis |
|---|---|---|
| $14.61–$15.65 | Resistance zone | Unfilled gap from April 8, 2026 — first major supply overhead |
| $15.16 | Resistance | July 23 swing high (0% of the recent up-swing) |
| $14.31 | Current | Close, Friday July 24 |
| $14.14 | Support | 23.6% retracement of the $10.85 → $15.16 swing |
| $13.51 | Support | 38.2% retracement; 1×ATR reference $13.56 nearby |
| $12.82 | Stop (2×ATR) | Objective invalidation — about 10.4% below the close |
| $12.50–$12.68 | Support cluster | 61.8% retracement $12.50 + SMA60 $12.61 + SMA20 $12.68 |
What to Watch
- The gap zone ($14.61–$15.65): a close inside or above it on expanding volume is the single most important bullish confirmation; repeated fades there mean supply is winning.
- Volume on strength: the rally has run on ~1.3× average volume — a 2×+ spike on an up day through resistance would upgrade the setup; rising volume on down days would do the opposite.
- Mansfield RS zero line: the outperformance flip is only weeks old; RS holding above zero keeps the leadership thesis intact, a drop back below removes it.
- ADX through 25: would move this from an “emerging” to a confirmed trend and validate trend-following entries.
- $12.82 (2×ATR stop): a daily close below it invalidates the recovery structure — no averaging down through that level.
Conclusion
Past Analyses of This Stock same ticker · newest first
This analysis is an educational interpretation of chart data and is not investment advice. Probabilities and levels are subjective estimates; every investment decision, and its outcome, is your own responsibility. A bottoming signal is not a buy signal — indicators describe what has happened, not what must happen next. High-volatility stocks like VG can move through stop levels with slippage; size positions accordingly.
Two Week Swing · twoweekswing.com · 4,600+ stocks screened weekly