Veeva Systems Inc.
This analysis is based on closing-price data as of July 10, 2026. Whether you're researching how to buy Veeva Systems stock or you've just opened a brokerage account and are trying to time an entry, here are objective support levels and stop-loss references built from the RSI, MACD and ATR indicators.
Veeva Systems is a beaten-down large cap attempting to turn: the stock collapsed from a $310.50 high last November and still trades 38.8% below it, but since December it has built a base in the $148–$190 range and now presses the top of that range. Price sits above a rising SMA20 and SMA60, a MACD golden cross from June 26 is widening, and the monthly relative-strength trend is improving — yet Mansfield RS remains deeply negative at -24.5% versus the S&P 500, the rally has run on roughly half of average volume, and the chart flags a bearish on-balance-volume divergence. This is a recovery attempt inside a damaged long-term chart, not yet a confirmed new uptrend.
Snapshot all values from the July 10, 2026 chart data
| Close | $190.12 | 52-week high / low | $310.50 (-38.8%) / $148.05 (+28.4%) |
|---|---|---|---|
| SMA5 / SMA20 / SMA60 | $190.46 / $172.07 / $167.77 | Bollinger (20) | $142.21 – $201.93, mid $172.07, width 34.71% |
| aVWAP (2y) | $214.00 (anchor May 29, 2025) — overhead supply | aVWAP (90d) | $169.61 (anchor May 1, 2026) — support below |
| RSI (14) | 65.9 — firm, nearing overbought | Mansfield RS (vs S&P 500) | -24.54% — underperform, rising slope |
| MACD (12,26,9) | 6.95 vs signal 4.52, histogram +2.43 — golden cross Jun 26, 2026 | ADX (14) | 24.1 — emerging trend |
| ATR (14) | $7.31 (3.84% of price) | Volume vs 20-day avg | 0.49x (1,266,863 vs 2,564,513) |
| OBV (2y) | Above rising 20-day MA, +18.82% (chart flags bearish divergence) | OBV (90d) | Above rising 20-day MA, +27.20% |
| 1×ATR stop | $182.81 | 2×ATR stop | $175.51 |
① Price & Moving Averages
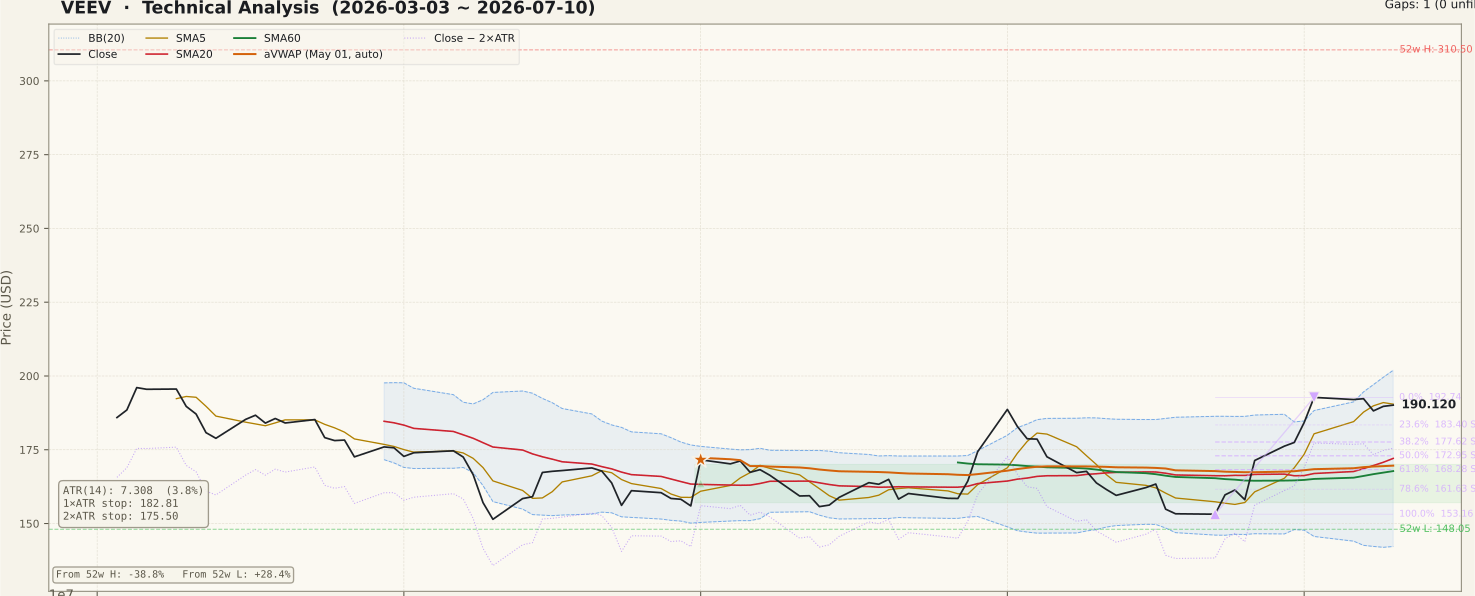
The two-year chart is dominated by the November–December 2025 breakdown: after topping at $310.50, VEEV fell through every moving average and spent the first half of 2026 carving out a base above the 52-week low of $148.05. Within the 90-day window the structure has improved: a June 22 swing low at $153.16, a sharp recovery to $192.74 on July 2, and a close at $190.12 that holds above the rising SMA20 ($172.07) and SMA60 ($167.77) — the moving averages have stacked back into bullish order for the first time since the breakdown. The close is essentially on the SMA5 ($190.46) and pressing the 0% line of the June-July swing at $192.74. Overhead, the burden of the long-term chart remains: the two-year anchored VWAP at $214.00 marks the average holder from the May 2025 anchor still underwater, and a large unfilled resistance gap from November 21, 2025 waits far above at $251.60–$269.30.
② Volume

The latest session traded 1,266,863 shares, just 0.49x the 20-day average of 2,564,513. That is the recurring weakness of this recovery: the June rebound and the July push toward $192 have both run on unremarkable volume, while the heaviest prints of the past 90 days — including the early-May spike above 35 million shares — sat on the down side of the tape. For a $190 large cap the absolute liquidity is excellent, so execution is not the concern; conviction is. A range-top breakout attempt at $192.74 on half-average volume would be a textbook candidate for a failed break. What would change the read is a close through the swing high with volume at or above the 20-day average — evidence that institutions, not just the absence of sellers, are driving the advance.
③ MACD

MACD printed a golden cross on June 26, 2026 and the signal has strengthened since: MACD at 6.95 rides above the signal line at 4.52 with a widening green histogram of +2.43, and both lines have pushed decisively above zero. On the 90-day chart this is the strongest momentum configuration since the recovery began — the histogram has expanded for two consecutive weeks rather than stalling after the cross. The caveat is context: on the two-year chart this is the third meaningful MACD upturn since the December collapse, and the prior two (January and April) each faded once price met the falling longer-term averages. Momentum is genuinely positive here; whether it survives first contact with the $192.74–$201.93 resistance zone is the actual test.
④ RSI

RSI(14) stands at 65.9, close to but not through the overbought threshold. The 90-day arc is constructive: an oversold dip in mid-April, a bottoming sequence of higher lows through May and June, a tag of 70 in early June, and now a second approach to 70 as price presses the range top. In a stock transitioning out of a downtrend, repeated visits to the high 60s are what accumulating demand looks like — but a stall here, at range-top resistance with RSI near 70 and volume thin, is also exactly where failed range breakouts are born. No RSI divergence is flagged in the data at the July highs. The pragmatic read: RSI above 50 keeps the recovery structure intact; a rejection at $192.74 that drags RSI back below 50 would mark another leg of range-bound work.
⑤ Mansfield Relative Strength

Mansfield RS versus the S&P 500 is -24.54% — deeply negative. Whatever the 90-day price chart suggests, the market has kept VEEV a pronounced underperformer since the November breakdown, and this is the single biggest strike against the setup. The internals are mixed rather than uniformly bad: a month ago RS was -35.80, so the monthly change of +11.3 points is genuine improvement toward the zero line; but a week ago it was -23.47, making the weekly change -1.1 points — in negative territory a further decline reads as deterioration, meaning the improvement stalled this week even as price held near its recovery high. Deeply negative RS with strong-looking price action is a classic trap pattern for newer investors: the stock can rally hard and still lag the index. Until the RS line crosses zero, VEEV is a mean-reversion trade, not a leadership trade.
⑥ ATR & ADX volatility & trend strength

ADX(14) reads 24.1 — an emerging trend, just under the >25 threshold that marks a strong one. It has curled up from the sub-20 chop of May and June, consistent with a new directional move taking shape but not yet proven. ATR(14) is $7.31, or 3.84% of the close — elevated for a large cap (the November–December crash reset this name's volatility regime) but well below the double-digit percentages of small-cap movers. The derived risk references: the 1×ATR level sits at $182.81 and the 2×ATR stop at $175.51, about 7.7% below the close and conveniently just above the 38.2% retracement at $177.62 — meaning the objective stop and the swing structure roughly agree on where this recovery would be broken.
⑦ OBV on-balance volume

OBV is the chart's most conflicted indicator, so both sides deserve stating. On the constructive side, OBV sits above its rising 20-day average on both windows — by +18.82% on the two-year chart and +27.20% on the 90-day chart — which is why the data tags the state as accumulation. On the cautionary side, the chart flags a bearish OBV divergence: cumulative volume flow collapsed with the early-May distribution spike and, even after the June-July recovery, the OBV line remains far below its spring levels while price has returned to the top of its range — the buying that lifted price has not replaced the volume that left. Both observations are true at different scales: flow has improved over recent weeks, but the recovery is volume-poor relative to the damage. A push to new recovery highs in price without OBV following would sharpen the divergence; an OBV breakout alongside price would neutralize it.
Bull Case vs Bear Case
Bull Case
- MACD golden cross June 26 with a widening histogram — strongest momentum since the breakdown.
- Moving averages re-stacked bullishly: close above rising SMA20 ($172.07) and SMA60 ($167.77).
- Monthly RS change +11.3 points — underperformance is shrinking on the month.
- Seven-month base above $148–$153 with a higher June low — time-tested support.
- Price above the 90-day anchored VWAP ($169.61) — recent accumulators are in profit.
- ADX turning up through 24 — an emerging trend forming out of a long chop.
Bear Case
- Mansfield RS -24.5% vs the S&P 500 — still a deep market underperformer.
- Weekly RS change -1.1 points — in negative territory, this week reads as deterioration.
- Rally on ~0.5x average volume; the heaviest recent volume was on the sell side (early May).
- Chart-flagged bearish OBV divergence — price at range highs, cumulative flow far below spring levels.
- Heavy overhead supply: $192.74 swing high, $201.93 Bollinger upper band, 2-year aVWAP $214.00, unfilled gap $251.60–$269.30.
- Still 38.8% below the 52-week high — every rally since November has been sold at the longer-term averages.
Scenarios
| Scenario | Probability | Path | Trigger / Invalidation |
|---|---|---|---|
| Range-top breakout | ~40% | A volume-backed close above $192.74 extends the recovery toward the Bollinger upper band at $201.93, with the $214.00 two-year aVWAP as the larger overhead test. | Trigger: daily close above $192.74 on at least average volume. Invalidation: immediate reversal back below $183.40. |
| Rejection and more base-building | ~40% | The range top holds again on thin volume; price retraces into the $183.40–$177.62 fib zone and works sideways above the SMA20 near $172 while the base extends. | Trigger: failure at $192.74 with RSI slipping from near-70. Structure stays constructive above $172. |
| Recovery fails | ~20% | Loss of the SMA20/50% retracement band around $172–$173 unwinds the golden cross and sends price back toward the $161.63 (78.6%) and $153.16 swing-low supports. | Trigger: daily close below $175.51 (2×ATR stop) — this invalidates the swing setup outright. |
Probabilities are subjective estimates based on the chart evidence above, not forecasts.
Key Levels
| Price | Role | Basis |
|---|---|---|
| $192.74 | Resistance | July 2 swing high — 0% of the June-July swing; range top since December |
| $190.46 | Pivot | SMA5 — price closed a hair below it |
| $190.12 | Current close | July 10, 2026 |
| $183.40 | Support | 23.6% retracement (1×ATR reference $182.81 in the same zone) |
| $177.62 | Support | 38.2% retracement of the June-July swing |
| $175.51 | Stop-loss reference | 2×ATR stop — objective invalidation of the swing setup (-7.7% from close) |
| $172.07 | Support | SMA20 / Bollinger midline; 50% retracement $172.95 adjacent |
What to Watch
- Volume on any close above $192.74 — at least the 20-day average (~2.56M shares) is the minimum bar for trusting a range-top break.
- Whether OBV makes a new recovery high alongside price — that would neutralize the flagged bearish divergence; a lagging OBV sharpens it.
- The weekly Mansfield RS change: a return to positive weekly change would restore the improving-RS story; further slippage deepens the underperformance case.
- The $172–$173 band (SMA20 + 50% retracement) — the structural floor of this recovery attempt.
- ADX through 25 — confirmation that the emerging trend has matured into a strong one.
Conclusion
Past Analyses of This Stock same ticker · newest first
This analysis is an educational interpretation of chart data and is not investment advice. Probabilities and levels are subjective estimates; every investment decision, and its outcome, is your own responsibility. The November 2025 decline in this stock was driven by more than chart mechanics — if a stock has made an outsized news-driven move, technical signals alone are not a sufficient basis to act; check the fundamental catalyst first.
Two Week Swing · twoweekswing.com · 4,600+ stocks screened weekly