Triumph Financial, Inc.
$80.61 −0.0% from 52-week high · +73.6% above 52-week low
This analysis is based on closing-price data as of July 17, 2026. Whether you're researching how to buy Triumph Financial, Inc. stock or you've just opened a brokerage account and are trying to time an entry, here are objective support levels and stop-loss references built from the RSI, MACD and ATR indicators.
Over the past two years TFIN traced a full boom-bust-recovery cycle: a sharp late-2024 peak, a deep 2025 decline to the $46.43 fifty-two-week low, and then a steady multi-month climb that has now carried the stock 73.6% off that low to $80.61 — within two cents of a new 52-week closing high, printed on 1.5x average volume. Relative strength is doing the heavy lifting: Mansfield RS versus the S&P 500 stands at +20.17% and is accelerating on both weekly and monthly windows, with a fresh MACD golden cross on July 17 adding a momentum tailwind. The caveat sits in the RSI panel, where the chart flags a bearish divergence — price made a higher high than June 12 while RSI printed a lower high — so this is a strong, market-leading breakout attempt that has not yet fully confirmed its momentum.
Snapshot all values from chart JSON, July 17, 2026
| Item | Value | Reading |
|---|---|---|
| Close | $80.61 | −0.0% from 52w high, +73.6% above 52w low |
| 52-week high / low | $80.63 / $46.43 | pressing the very top of the yearly range |
| SMA 5 / 20 / 60 | $79.05 / $76.93 / $71.25 | bullish stack, close above all three |
| Bollinger (upper / mid / lower) | $81.40 / $76.93 / $72.45 | width 11.64% — close hugging the upper band |
| aVWAP 90d (anchor Apr 22, 2026) | $71.54 | price well above — recent buyers in profit |
| aVWAP 2y (anchor Jan 23, 2025) | $61.74 | long-term average buyer deep in profit |
| RSI(14) | 64.92 | bearish divergence flagged vs the June 12 peak |
| Mansfield RS vs the S&P 500 | +20.17% | outperforming and accelerating (prev week +15.18, prev month +6.89) |
| MACD (12,26,9) | 2.02 / 1.99 / +0.03 | golden cross July 17 above zero — fresh, histogram still thin |
| ADX(14) | 26.99 | strong trend strength |
| ATR(14) | $2.57 (3.19%) | moderate daily volatility |
| OBV | 2y: accumulation / 90d: accumulation | above MA20 and rising on both frames |
| Volume vs 20-day avg | 1.50x | breakout session on expanding volume |
| ATR stops (1x / 2x) | $78.04 / $75.48 | objective invalidation references |
① Price & Moving Averages
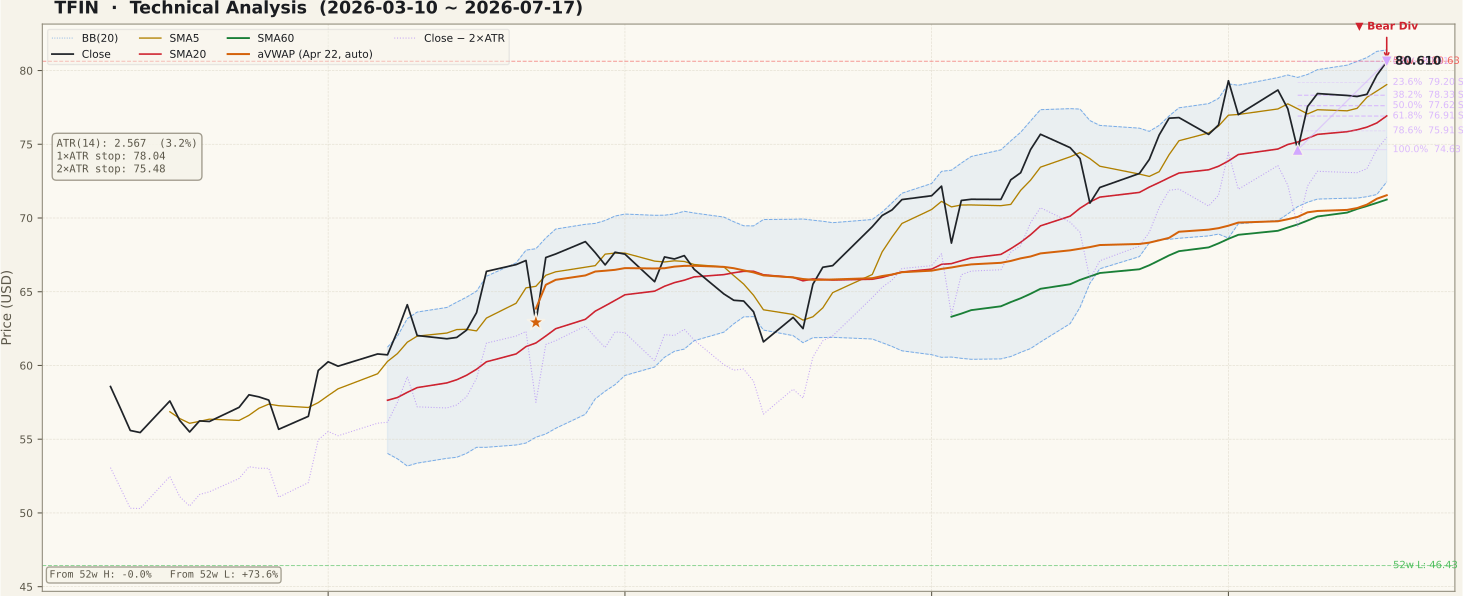
The 90-day chart is a textbook staircase: price has climbed from the mid-$50s in March to $80.61, riding SMA5 ($79.05) with SMA20 ($76.93) and SMA60 ($71.25) stacked bullishly below and all three sloping up. The close sits just under the upper Bollinger band ($81.40) after weeks of walking its upper half — band-walking behavior that marks a persistent trend, but also a statistically stretched entry point. The Fibonacci grid on the current July 8 to July 17 up-swing ($74.63 to $80.61) places first retracement supports at $79.20 (23.6%) and $78.33 (38.2%), with the 61.8% level at $76.91 landing almost exactly on the SMA20 / Bollinger mid-band at $76.93 — a natural confluence shelf for any pullback. On the two-year frame, the structure is clean: the entire 2026 recovery has reclaimed the ground lost in 2025, there are no unfilled gaps below, and the only remaining overhead reference is the late-2024 peak zone visible well above current prices on the long-term chart.
② Volume

The push to the top of the yearly range came on 499,200 shares against a 332,640-share 20-day average — 1.50x, a genuine expansion rather than a drift higher. That matters because the classic beginner trap is buying a breakout that volume never validated; here the tape is doing what a real breakout should, and July has printed several other above-average accumulation sessions. The bar to keep watching is the one that closes above the $80.63 intraday high: if that session also runs at or above the 20-day average, the breakout has the participation it needs. A poke above the high on shrinking volume would be the warning version of the same event.
③ MACD

MACD (2.02) crossed back above its signal line (1.99) on July 17 — the same session as the range-high close — and the cross occurred well above the zero line, the profile of trend re-acceleration rather than a bottom call. The honest caveat is the histogram: at +0.03 it has only just flipped positive, so this golden cross is hours old in indicator terms and carries little cushion. The 90-day panel shows the pattern of this uptrend clearly — a series of shallow dead crosses that never broke the price structure, each resolved by a new golden cross. If the histogram expands over the next few sessions the pattern repeats; if it stalls near zero while price hovers under $80.63, momentum is failing at the highs.
④ RSI

RSI(14) reads 64.92 — firm, but below the overbought line — and this panel carries the chart's one explicit warning: a flagged bearish divergence. On June 12 price hit $75.68 with RSI at 70.92; on July 17 price reached a higher high at $80.61 while RSI printed a lower high at 64.92. Price is making progress that momentum is not confirming. Two things keep this in perspective. First, a divergence is a possibility of reversal, not a confirmation — in strong uptrends these flags frequently resolve when RSI simply pushes back through 70 on the next leg. Second, the divergence only gains teeth if price breaks a level while it is active. Until $79.20–$78.33 gives way, the divergence is a reason for tighter risk control, not an exit signal by itself.
⑤ Mansfield Relative Strength

Mansfield RS vs the S&P 500 stands at +20.17% — TFIN is not just rising, it is beating the index by a wide margin, and the gap is widening. A week ago the reading was +15.18 (a +4.99-point gain) and a month ago +6.89 (+13.28 points), so this is positive-and-accelerating, the strongest quadrant relative strength offers. The 90-day panel shows the character change: RS spent the spring oscillating around zero, crossed decisively positive in June, and has held a rising green zone since. Market-leading RS at a new 52-week high is the signature of institutional sponsorship, and it is the main reason the bull case here is more than a momentum chase. The flip side: when a leader this extended loses its RS slope, pullbacks tend to be swift, so a stall in this panel would matter as much as one in price.
⑥ ATR & ADX

ADX at 26.99 sits above the 25 threshold that defines a strong trend — and remember ADX measures strength, not direction; here it is rising alongside an advancing price, the bullish combination. ATR at $2.57 is 3.19% of the share price, a moderate volatility profile that makes stop math manageable: the 1x ATR reference sits at $78.04, essentially on top of the 38.2% Fibonacci retracement at $78.33, and the 2x ATR stop at $75.48 lies about 6.4% below the close, just under the 78.6% retracement at $75.91 and just above the $74.63 swing low. That alignment between the volatility-based stop and the price structure is convenient — a close below $75.48 would break both at once, making the invalidation unambiguous.
⑦ OBV (On-Balance Volume)

OBV is in an accumulation state on both timeframes — above its 20-day average and rising — and unlike the RSI panel, this volume-flow measure is confirming the new high: the 90-day OBV (4,804,300) sits 56.22% above its average (3,075,370), and on the two-year frame the divergence is even wider at 121.91%, with OBV surging to fresh highs alongside price. When price and RSI disagree, OBV is a useful tiebreaker, and right now it sides with the buyers — the money-flow pattern reads like genuine institutional accumulation into the breakout rather than distribution at the top. The bearish version of events would need OBV to roll below its 20-day average while price stalls under $80.63; nothing in the current data shows that yet.
Bull Case vs Bear Case
Bull Case
- Closed within $0.02 of a new 52-week high on 1.50x average volume — a participation-backed breakout attempt
- Bullish moving-average stack: $80.61 above SMA5 > SMA20 > SMA60, all rising
- Mansfield RS +20.17% vs the S&P 500 and accelerating: +4.99 pts week-over-week, +13.28 pts month-over-month
- MACD golden cross July 17, printed above the zero line — trend re-acceleration profile
- OBV in accumulation on both frames, confirming the price high (2y divergence +121.91% above its MA20)
- ADX 26.99 strong trend, no unfilled gaps below, price above both anchored VWAPs ($71.54 / $61.74)
Bear Case
- Flagged RSI bearish divergence: price higher high $75.68 → $80.61 while RSI made a lower high 70.92 → 64.92
- Close pressed against the upper Bollinger band at $81.40 — short-term stretched, little headroom before mean-reversion risk
- Fresh golden cross histogram is only +0.03 — the momentum turn is real but unproven
- The 52-week intraday high at $80.63 has not yet been cleared on a closing basis — the breakout is unconfirmed
- +73.6% above the 52-week low after a four-month run — profit-taking supply grows near round milestones
- The two-year chart shows a late-2024 peak zone well above — long-term holders from that era remain underwater overhead
Scenarios
| Scenario | Probability | Path | Trigger / Invalidation |
|---|---|---|---|
| Breakout extension | ~40% | Clears the $80.63 fifty-two-week high, the Bollinger upper band expands to accept price, and TFIN enters a price-discovery leg with RS leadership intact. | Trigger: daily close above $80.63 on volume at or above the 20-day average. Invalidated by a quick slip back below $79.20. |
| Divergence pullback, then higher | ~35% | The RSI divergence bites first: rejection near $80.63–$81.40, retrace into the $77.62–$76.91 Fibonacci 50–61.8% band that overlaps SMA20, RSI resets, and the uptrend resumes. | Trigger: stall under $80.63 with a fading histogram. Constructive while daily closes hold above $75.48. |
| Failed breakout | ~25% | Supply at the yearly high wins, the fresh golden cross fails, and price breaks the swing structure toward SMA60 ($71.25) and the 90-day anchored VWAP ($71.54). | Trigger: daily close below the 2x ATR stop at $75.48 — the swing thesis is negated there, with the $74.63 swing low the confirming break. |
Key Levels
| Price | Role | Basis |
|---|---|---|
| $81.40 | Resistance | Bollinger upper band |
| $80.63 | Resistance | 52-week high — breakout confirmation line |
| $80.61 | Current | Close, July 17, 2026 / Fibonacci 0% of the July up-swing |
| $79.20 | Support | Fibonacci 23.6% retracement of the July 8–17 up-swing |
| $78.33 | Support | Fibonacci 38.2% retracement + 1x ATR reference ($78.04) |
| $76.91 | Support | Fibonacci 61.8% retracement + SMA20 / Bollinger mid ($76.93) |
| $75.48 | Stop-loss | 2x ATR below close — objective invalidation, just above the $74.63 swing low |
What to Watch
- A daily close above $80.63 — and whether that session's volume holds at or above the 20-day average. That is the difference between a confirmed breakout and a trap.
- RSI behavior on the next price high: a push back above 70 repairs the bearish divergence; another lower RSI high while price stalls deepens it.
- The MACD histogram (+0.03 at the cross) — expansion over the coming sessions validates the July 17 golden cross; a flat-line near zero at the highs does not.
- Buyer response in the $78.33–$76.91 retracement band on any pullback — demand there keeps the staircase structure intact.
- A daily close below $75.48 (2x ATR stop) — mechanical exit; the swing thesis fails there.
Conclusion
Past Analyses of This Stock same ticker · newest first
This analysis is an educational interpretation of chart data and is not investment advice. Probabilities and levels are subjective estimates; every investment decision, and its outcome, is your own responsibility. A breakout signal is not a buy signal until it is confirmed. All figures are derived from closing-price data as of July 17, 2026 and may be outdated by the time you read this.
Two Week Swing · twoweekswing.com · 4,600+ stocks screened weekly