Steven Madden, Ltd.
$46.08 −5.5% vs 52-week high ($48.76)
This analysis is based on closing-price data as of July 31, 2026. Whether you're researching how to buy Steven Madden, Ltd. stock or you've just opened a brokerage account and are trying to time an entry, here are objective support levels and stop-loss references built from the RSI, MACD and ATR indicators.
SHOO spent late 2024 and the first half of 2025 in a deep, orderly decline into a $23.15 low, then rebuilt through a year-long recovery that has now doubled the stock off that base — it closed the week +99.0% above the 52-week low and only 5.5% under the 52-week high. The final two sessions did the heavy lifting: a powerful surge on July 30 to a $47.83 close, then a push to a new 52-week high at $48.76 on July 31 that was sold back to $46.08 by the bell on 2.24× average volume. The working lens is a fresh, catalyst-sized breakout still being tested — relative strength has just flipped decisively positive (+13.5% vs the Nasdaq Composite from −1.3% a month ago), but a single wide-range reversal candle is not yet proof that the breakout has been absorbed.
Snapshot all values from the July 31, 2026 close
| Item | Value | Quick read |
|---|---|---|
| Close | $46.08 | −5.5% from the 52w high, +99.0% off the 52w low |
| 52-week high / low | $48.76 / $23.15 | Top of the yearly range — the high was set on the latest session |
| SMA 5 / 20 / 60 | $44.98 / $42.78 / $42.42 | Close above all three — bullish stack, with SMA20 and SMA60 nearly flat and converged |
| Bollinger (upper / mid / lower) | $46.90 / $42.78 / $38.67 | Width 19.26% — price is pressed against the upper band |
| aVWAP 90d (Jun 26 anchor) | $42.80 | Price well above — summer buyers are in profit |
| aVWAP 2y (Jul 30, 2025 anchor) | $36.82 | Base-era holders deep in profit — little trapped supply below |
| RSI(14) | 60.9 | Bullish but not overbought; bearish divergence flagged into the Jul 30 high |
| Mansfield RS (vs Nasdaq Composite) | +13.5% | Outperforming; +5.8 pts vs last week, +14.8 pts vs a month ago (from −1.3%) |
| MACD (12,26) | 0.85 / signal 0.42 | Golden cross on Jul 15, histogram +0.42 and widening |
| ADX(14) | 17.9 (90d: 18.3) | Below 20 — ranging, no established trend strength yet |
| ATR(14) | $1.88 (4.08%) | Wide daily range — size positions accordingly |
| OBV (90d / 2y) | −4.05M / −16.69M | Both above their 20-day averages — 90d accumulation and rising (+9.04%), 2y early accumulation but flat (+2.36%) |
| Volume (last / 20-day avg) | 2,262,100 / 1,010,585 | 2.24× average on the latest session |
| 1× / 2× ATR stop | $44.20 / $42.32 | Objective invalidation references |
① Price & Moving Averages
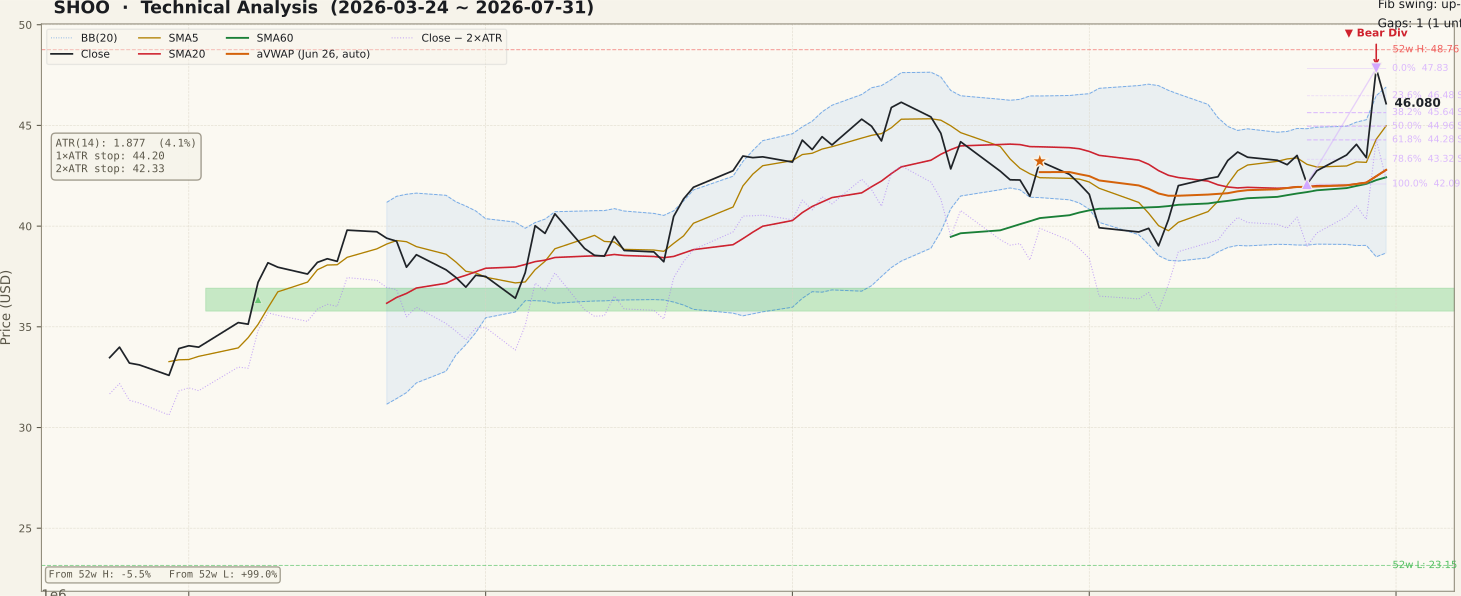
The 90-day chart shows two very different regimes. From late March to mid-June price climbed steadily from the mid-$30s to roughly $46, then spent six weeks grinding sideways and lower into a $42.09 swing low on July 23 — a textbook consolidation that pulled SMA20 ($42.78) and SMA60 ($42.42) almost on top of each other. The last two sessions broke that range emphatically: the July 30 close at $47.83 cleared the June highs, and July 31 reached a new 52-week high at $48.76 before closing at $46.08, leaving a long upper wick. The moving-average stack is now bullish (close > SMA5 $44.98 > SMA20 $42.78 > SMA60 $42.42), and the close sits just under the Bollinger upper band at $46.90 with the band width at 19.26%. Below price, the retracement grid of the July 23 → July 30 swing gives the first real tests at $46.48 (23.6%) and $45.64 (38.2%); far beneath, the unfilled April 8 gap at $36.92–$35.78 remains the deep structural floor.
② Volume

The latest session traded 2,262,100 shares against a 1,010,585 20-day average — 2.24× normal — and the July 30 surge carried a comparable spike. Two consecutive volume spikes of that size after weeks of sub-average turnover is the signature of an event, not of ordinary rotation, and the honest reading cuts both ways. Expanding volume confirms that the range break was real rather than a thin drift, which is exactly what a beginner should demand before trusting a breakout. But the heaviest volume day of the pair is also the day price closed 5.5% under its own high — heavy supply met the move at the top of the range. The rest of the 90-day window shows generally balanced green and red bars near the 1M average, so liquidity is adequate and these two bars genuinely stand out.
③ MACD

MACD delivered a golden cross on July 15, and the separation has widened since: the line at 0.85 now sits well above its 0.42 signal with a +0.42 histogram. The context that matters is altitude — that cross occurred close to the zero line after a multi-week negative stretch, which is the early-stage configuration rather than the late-stage one, and it leaves room for the move to extend before momentum is stretched. The caution is that the histogram's sharpest expansion came from the two-session surge itself, so a fair part of this reading is a single event repricing rather than a slow accumulation of momentum. Watch whether the histogram holds its width over the next several sessions; a rapid collapse back toward zero would mark the surge as a one-off.
④ RSI

RSI reads 60.9 — bullish territory, clearly reset from Friday's giveback and still short of the overbought line. The chart tool flags a bearish divergence: on June 12 price was $46.15 with RSI at 71.86, and on July 30 price made a higher high at $47.83 while RSI reached only 69.52. That non-confirmation is real but narrow — roughly two RSI points across a seven-week gap — so it is a caution flag, not a top call. The frequent beginner error here is to treat any flagged divergence as a sell signal; a divergence is a possibility of reversal and needs price confirmation, which in this case would mean losing the $45.64 retracement shelf. The constructive counter-read is that RSI cooling into the low 60s while price holds most of a two-session advance is normal digestion, not deterioration.
⑤ Mansfield Relative Strength

Mansfield RS stands at +13.5% vs the Nasdaq Composite and the trajectory is the strongest single element on this page. A month ago the reading was −1.3% — below the zero line, lagging the index — and it is now +14.8 points higher, a genuine crossover from underperformance into outperformance rather than a marginal improvement. Week over week it added a further +5.8 points (7.75 → 13.52), so this is positive and accelerating, not positive and fading. On the two-year panel the picture is a long climb out of a deep −40% trough in mid-2025 back above zero, with the current reading near the upper end of the past year's range. The reservation is timing: much of the latest acceleration came from the same two sessions that drive every other reading here, so a single flat week for the stock would take some of it back.
⑥ ATR & ADX

ADX at 17.9 on the two-year frame (18.3 on 90 days) sits below the 20 threshold and reads ranging — the six weeks of sideways action before the surge suppressed trend strength, and two days is not enough to rebuild it. That is a useful discipline check: the price structure looks like a breakout, but the trend-strength indicator has not confirmed one yet, and ADX typically lags a genuine regime change by a couple of weeks. ATR has jumped to $1.88, or 4.08% of price — the vertical spike at the right edge of the panel is the volatility expansion from the two large sessions. Practically, that puts the 1× ATR reference at $44.20 and the 2× ATR stop at $42.32, roughly 8.2% below the close. If that distance is more risk than a plan tolerates, the answer is a smaller position, not a tighter stop that ordinary 4% daily swings would trip.
⑦ OBV (On-Balance Volume)

On the 90-day frame OBV at −4.05M sits above its 20-day average (−4.45M) with a rising slope and a +9.04% divergence — tagged accumulation. The two-year frame agrees in direction but not in conviction: OBV at −16.69M is only +2.36% above its average with a flat slope, tagged early accumulation, and the absolute level remains deeply negative after the 2025 decline — volume flow has stabilised, not repaired. One caveat the chart raises without a matching data field: the panel header flags an OBV bearish divergence into the July 30 high, meaning the cumulative line has not made a new high alongside price. Reading those together, the flow supports the recent advance on the short frame but has not yet confirmed it on the longer one, which is a reason to want follow-through rather than to assume it.
Bull Case vs Bear Case
Bull Case
- Mansfield RS crossed from −1.3% to +13.5% vs the Nasdaq Composite in a month (+14.8 pts) and added +5.8 pts on the week — positive and accelerating.
- Bullish moving-average stack: close $46.08 above SMA5 $44.98, SMA20 $42.78 and SMA60 $42.42.
- MACD golden cross on July 15 from near the zero line, with the line (0.85) pulling away from the signal (0.42) and a +0.42 histogram.
- A new 52-week high at $48.76 was reached on the latest session — the stock is +99.0% off the $23.15 low, with no overhead supply from the past year.
- OBV above its 20-day average on both frames — accumulation and rising on 90 days (+9.04% divergence).
- Both aVWAP references sit far below price ($42.80 from the Jun 26 anchor, $36.82 from the Jul 30, 2025 anchor), so holders are in profit and sell pressure from trapped buyers is minimal.
Bear Case
- The latest session reached $48.76 and closed at $46.08 — a wide upper wick on 2.24× average volume, which is what heavy supply at a high looks like.
- RSI bearish divergence flagged: $46.15 with RSI 71.86 on June 12 versus a higher $47.83 with RSI 69.52 on July 30.
- ADX 17.9 reads ranging — the two-day move has not yet produced measurable trend strength, and the prior six weeks were directionless.
- The close is pinned against the Bollinger upper band ($46.90) after a volatility expansion to 19.26% width — a statistically stretched location for a fresh entry.
- On the two-year frame OBV is only +2.36% above its average with a flat slope, and the chart separately flags an OBV non-confirmation into the July 30 high.
- ATR at 4.08% of price puts the 2× ATR stop about 8.2% away ($42.32) — a wide and expensive invalidation for a move built on two sessions.
Scenarios
| Scenario | Probability | Path | Trigger / Invalidation |
|---|---|---|---|
| Breakout absorbs the supply | ~40% | Price holds the $46.48–$45.64 retracement band (23.6–38.2% of the Jul 23 → Jul 30 swing), volume contracts on the pause, then a push back through $47.83 opens the $48.76 high and unmarked territory above it. | Trigger: a daily close above $47.83 on above-average volume with the MACD histogram holding its width. Invalidated by a daily close below $45.64. |
| Range digestion at a higher shelf | ~38% | The giveback extends toward the 50–61.8% zone ($44.96–$44.28), where SMA5 ($44.98) and the 1× ATR reference ($44.20) cluster, and the stock builds a new base there while ADX rebuilds from below 20. | Trigger: a daily close below $45.64 without a volume spike. Constructive while $44.28 holds on a closing basis; failure of that shelf shifts weight to the third scenario. |
| Breakout fails, full give-back | ~22% | Supply keeps overwhelming demand; price unwinds the entire two-session advance back to the $42.09 swing low and the converged SMA20 / SMA60 zone ($42.78 / $42.42), closing below the 2× ATR stop on the way. | Trigger: a daily close below $42.32, especially on above-average volume. Below $42.09 the July range low is gone and the setup should be abandoned. |
Key Levels
| Price | Role | Basis |
|---|---|---|
| $48.76 | Resistance | 52-week high, set on the Jul 31 session |
| $47.83 | Resistance | Jul 30 close — 0% of the current swing |
| $46.48 | Support | 23.6% retracement of the Jul 23 → Jul 30 swing; Bollinger upper band just above at $46.90 |
| $46.08 | Current | Jul 31 close |
| $44.96 | Support | 50% retracement, sitting on SMA5 ($44.98) |
| $44.28 | Support | 61.8% retracement, with the 1× ATR reference at $44.20 |
| $42.32 | Stop-loss | 2× ATR below the close — objective invalidation (~8.2% risk); SMA20 $42.78 and the $42.09 swing low frame the same zone |
What to Watch
- The $46.48 / $45.64 band (23.6–38.2% retracement): holding it on a closing basis keeps the breakout intact; losing it turns the two-session move into a spike to be faded.
- Volume on the pullback: contracting turnover while price consolidates is the healthy pattern; another 2× volume down session would say supply is still in control.
- ADX crossing 20: the one confirmation still absent. Trend strength building above 20 would upgrade this from a range break to an established move.
- MACD histogram width: holding near +0.42 sustains the July 15 cross; a fast collapse toward zero marks the surge as an isolated event.
- OBV on the two-year frame: a rising slope instead of flat, and a clear step above the −17.09M average, would resolve the flagged non-confirmation.
Conclusion
Past Analyses of This Stock same ticker · newest first
This analysis is an educational interpretation of chart data and is not investment advice. Probabilities and levels are subjective estimates; every investment decision, and its outcome, is your own responsibility. Technical signals alone are not a reason to buy a stock that has just experienced a major fundamental event — always check the underlying catalyst first.
Two Week Swing · twoweekswing.com · 4,600+ stocks screened weekly