Spotify Technology S.A.
$499.94 −33.2% from 52-week high $748.30
This analysis is based on closing-price data as of July 31, 2026. Whether you're researching how to buy Spotify Technology S.A. stock or you've just opened a brokerage account and are trying to time an entry, here are objective support levels and stop-loss references built from the RSI, MACD and ATR indicators.
Spotify spent the past year unwinding a major advance: from a 52-week high of $748.30 the stock slid to a $405.00 low and has since spent spring and summer building a wide base, closing at $499.94 — still −33.2% below that high but +23.4% above the low. The 90-day picture is more constructive than the two-year one: the moving averages are stacked bullishly (SMA5 $510.57 > SMA20 $489.63 > SMA60 $476.41), MACD crossed above its signal line on July 27, 2026, and on-balance volume reads as accumulation on the 90-day window. What has not repaired is the market-relative picture — Mansfield RS is −18.1% versus the S&P 500, improving but still deep below zero, while ADX at 11.7 describes a range rather than a trend. The lens for the next two weeks: does the pullback from the July 29 swing high at $524.01 hold the $489.63–$496.50 shelf, or does the base simply keep absorbing every push?
Snapshot all values from the July 31, 2026 close
| Item | Value | Read |
|---|---|---|
| Close | $499.94 | −33.2% from 52w high / +23.4% from 52w low |
| 52-week high / low | $748.30 / $405.00 | lower half of a very wide 12-month range |
| SMA 5 / 20 / 60 | $510.57 / $489.63 / $476.41 | bullish stack; close sits below SMA5 but above SMA20 and SMA60 — a pullback inside the stack |
| Bollinger (20, 2) | $519.76 / $489.63 / $459.49 | width 12.31%; price in the upper half, off the band |
| aVWAP 90d | $470.90 (anchor Apr 28, 2026) | price above — buyers since the spring drawdown are in profit |
| aVWAP 2y | $544.94 (anchor Jul 29, 2025) | price below — the average two-year buyer is still under water |
| RSI (14) | 54.5 | neutral-positive; no divergence flagged in the data |
| MACD (12, 26, 9) | 8.62 / signal 5.31 / hist +3.32 | golden cross July 27, 2026; both lines above zero |
| Mansfield RS (vs the S&P 500) | −18.1% | underperforming but improving: +2.70 pts vs last week, +5.61 pts vs a month ago |
| ADX (14) | 11.7 | ranging / weak — no established trend either way |
| ATR (14) | $18.21 (3.64%) | wide daily range for a large-cap — size positions accordingly |
| OBV 2y / 90d | Early accumulation / Accumulation | above MA20 on both; flat slope on 2y, rising on 90d |
| Volume vs 20d avg | 1.40× | 2,296,300 shares vs a 1,642,195 average — active, not frantic |
| 1× / 2× ATR stop | $481.73 / $463.52 | 2× ATR stop is −7.3% below the close |
① Price & Moving Averages
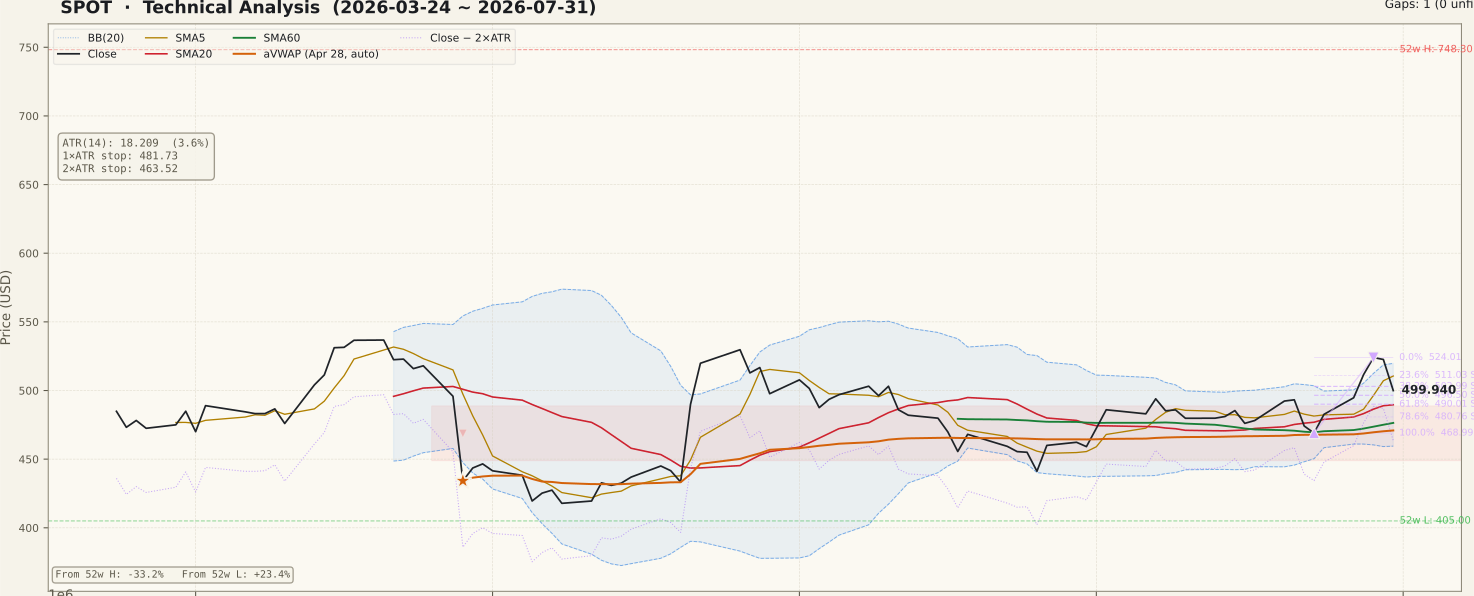
The two-year chart tells the bigger story: a long advance topped out in mid-2025 near the $748.30 52-week high, then rolled over into a persistent decline through the back half of 2025 and into early 2026, bottoming at $405.00. Since spring the tape has flattened into a wide base, and the 90-day window shows that base tightening — the moving averages have turned up and are now stacked bullishly (SMA5 $510.57 > SMA20 $489.63 > SMA60 $476.41), with the close of $499.94 above the 20- and 60-day lines but below the 5-day: the classic signature of a short-term pullback inside a rebuilt structure. Measured against the recent July 23 → July 29 up swing ($468.99 → $524.01), price has already given back into the middle of the move, sitting between the 38.2% retracement at $502.99 and the 50% at $496.50, with the 61.8% level at $490.01 almost exactly on the SMA20 and Bollinger mid at $489.63. Price holds above the 90-day anchored VWAP ($470.90, anchored April 28, 2026) but remains well below the two-year anchored VWAP at $544.94 — recent buyers are ahead, longer-term holders are not, and that gap is where overhead supply lives. On the two-year swing the same ceiling shows up at $529.71 (May 26, 2026 high), so the whole $520–$530 shelf is the level this base has to clear. Neither timeframe reports any unfilled gap.
② Volume

The last session traded 2,296,300 shares against a 20-day average of 1,642,195 — 1.40× normal. That is participation worth noting: the July push toward $524.01 and the pullback that followed both came on above-average turnover, which is a healthier signature than the drifting, low-volume rallies that litter the middle of this base. The 90-day panel also carries two much larger spike days earlier in the window, clustered around the spring drawdown — a reminder that the biggest volume in this stock has so far belonged to sellers, not buyers. For newer traders the discipline is simple: a breakout above $524.01 that arrives on volume below the 20-day average is exactly the kind of unconfirmed move that fails, and this base has already produced several of them.
③ MACD

MACD printed a golden cross on July 27, 2026 and now sits at 8.62 against a signal line of 5.31, with the histogram positive at +3.32. Both lines are above zero, which frames this as momentum re-asserting itself inside the base rather than a first turn off a low. The honest caveat is history: the two-year panel shows this indicator crossing back and forth repeatedly through the 2026 range, so a single cross inside a low-ADX tape is a weaker signal than the same cross inside a trending market. Sustained histogram expansion from here would confirm the July thrust has legs; a fresh dead cross while price is below $489.63 would say the range is reclaiming the move.
④ RSI

RSI(14) reads 54.5 — cooled from the near-70 area reached during the June push, and holding above the 50 line that usually separates pullbacks-within-structure from outright breakdowns. No bullish or bearish divergence is flagged in the data, and no divergence peaks are supplied, so there is nothing to build a reversal case on from this panel. The practical read is that momentum has reset without damage: there is no overbought excuse to fade the stock at 54.5, and equally no oversold bounce setup. Watch the 50 line — the spring low came with RSI in the high-20s, and a slide back under 50 would put this pullback into the deeper-consolidation path rather than the continuation one.
⑤ Mansfield Relative Strength

Mansfield RS versus the S&P 500 stands at −18.1% — SPOT is a confirmed underperformer, and that single fact should cap how aggressive any bullish read gets. The direction is the encouraging half: last week's reading was −20.78% and a month ago −23.69%, so relative strength has improved by +2.70 points over the week and +5.61 points over the month, with a rising slope. Because the line is still in negative territory, that improvement is correctly described as repair, not acceleration — the stock is losing to the index more slowly, which is not the same as winning. The two-year panel puts this in context: RS was strongly positive through most of 2024 and 2025, crossed below zero late in 2025, and reached its deepest reading earlier in 2026. Until this line crosses back above zero, market-wide weakness would likely weigh on SPOT harder than average, and every bullish price signal below carries that discount.
⑥ ATR & ADX

ATR(14) is $18.21, or 3.64% of price — a wide daily range for a company this size, and the reason the risk levels here look far away in dollar terms. ADX at 11.7 is well below the 20 threshold and has been grinding lower through the 90-day window: this is a ranging tape, not a trend. Remember that ADX measures trend strength and not direction — a low reading does not mean safety, it means neither buyers nor sellers have taken control, and breakouts from such conditions fail more often than they run. The objective risk anchors that follow from ATR: $481.73 at 1× and $463.52 at 2×, the latter −7.3% below the close and just above the lower Bollinger band at $459.49.
⑦ OBV (On-Balance Volume)

The two timeframes disagree in degree, and both readings matter. On the 90-day window OBV is in accumulation: above its 20-day average with a rising slope and a divergence reading of +28.44%, meaning volume flow has been leading price higher through the July recovery. On the two-year window the same indicator is only in early accumulation — above its average, but by just +3.88% and with a flat slope, because the long 2025–26 distribution phase left a large deficit that a few good weeks cannot erase. Read together, that is a stock where short-term demand is genuine but has not yet changed the long-term supply picture. If the 90-day OBV holds above its average while price works through this pullback, the accumulation case survives; if OBV rolls under its average alongside price, the July advance was a rally in a range rather than the start of something.
Bull Case vs Bear Case
Bull Case
- Bullish moving-average stack: SMA5 $510.57 > SMA20 $489.63 > SMA60 $476.41, with the close above both longer lines.
- MACD golden cross on July 27, 2026 with both lines above zero and a +3.32 histogram.
- OBV in accumulation on the 90-day window (+28.44% above its MA20, rising slope) — demand is leading price.
- Mansfield RS has repaired +5.61 points over a month and +2.70 over the week, with a rising slope.
- Price holds above the 90-day anchored VWAP at $470.90 — buyers since the April 28 anchor are in profit.
- Last session traded at 1.40× the 20-day average volume, and neither timeframe shows an unfilled gap overhead.
Bear Case
- Mansfield RS is still −18.1% versus the S&P 500 — a confirmed laggard until zero is reclaimed.
- Price is −33.2% below the 52-week high of $748.30, with a full year of overhead supply above.
- The two-year anchored VWAP sits at $544.94, far above price — the average long-term holder is under water.
- ADX 11.7 means no trend: this is range behaviour, where breakouts fail more often than they extend.
- The two-year OBV is only early accumulation (+3.88%, flat) — the long distribution phase is not undone.
- ATR at 3.64% of price puts the 2× ATR stop $36.42 away (−7.3%) — real dollar risk per share.
Scenarios
| Scenario | Probability | Path | Trigger / Invalidation |
|---|---|---|---|
| Pullback holds, base ceiling retested | ~40% | The dip stalls in the $496.50–$502.99 retracement band, price reclaims $510.57 and pushes back at the $519.76–$524.01 ceiling, with $529.71 the two-year swing high beyond it. | Trigger: close above $510.57 with volume at or above the 20-day average. Invalidation: a close below $489.63. |
| Range keeps absorbing | ~40% | SMA20 and the 61.8% retracement give way and price rotates back through $476.41 toward the 90-day anchored VWAP at $470.90 and the July 23 swing low at $468.99, while ADX stays under 20. | Trigger: close below $489.63 on rising volume. Invalidation of this path: a quick reclaim of $502.99. |
| Base fails | ~20% | Sellers press through $468.99 and the lower Bollinger band at $459.49; the stock heads back toward the spring lows and the two-year 61.8% retracement at $460.57 stops working as support. | Trigger: close below $468.99. The 2× ATR level at $463.52 is the objective exit reference. |
Key Levels
| Price | Role | Basis |
|---|---|---|
| $524.01 | Resistance | July 29, 2026 swing high — 0% of the July 23 → July 29 swing; upper Bollinger band $519.76 and the two-year swing high $529.71 frame the same ceiling |
| $510.57 | Resistance | SMA5, with the 23.6% retracement at $511.03 — the first line price has to take back |
| $502.99 | Support | 38.2% retracement of the July swing; the two-year 23.6% level sits at $503.31 |
| $499.94 | Current | July 31, 2026 close |
| $496.50 | Support | 50% retracement — the midpoint of the July advance |
| $489.63 | Support | SMA20 / Bollinger mid, with the 61.8% retracement at $490.01 on top of it |
| $476.41 | Support | SMA60; the 90-day anchored VWAP $470.90 and the swing low $468.99 sit just below |
| $463.52 | Stop-loss | 2× ATR below the close (−7.3%); also under the lower Bollinger band area at $459.49 |
What to Watch
- The $489.63–$496.50 shelf (SMA20 / Bollinger mid / 50–61.8% retracement) — the line between a routine pullback and a rotation back into the base.
- Volume on any push above $519.76–$524.01 — after a year of failed rallies, a ceiling test below the 20-day average volume is not worth trusting.
- Mansfield RS against the zero line — improvement from −23.69% to −18.1% is real repair, but only a cross above zero upgrades SPOT from laggard to leader.
- ADX turning up through 20 — the missing ingredient; without it, both breakouts and breakdowns tend to reverse inside the range.
- 90-day OBV versus its 20-day average — accumulation surviving this dip is the backbone of the constructive case.
Conclusion
Past Analyses of This Stock same ticker · newest first
This analysis is an educational interpretation of chart data and is not investment advice. Probabilities and levels are subjective estimates; every investment decision, and its outcome, is your own responsibility. Indicator values are taken from closing-price data as of July 31, 2026 and are not recalculated intraday. A bottoming signal is not a buy signal. If a stock moves sharply on news, earnings or other fundamental catalysts, do not act on technical signals alone — check the catalyst first.
Two Week Swing · twoweekswing.com · 4,600+ stocks screened weekly