RLI Corp.
$61.92 −10.6% from 52-week high
This analysis is based on closing-price data as of July 24, 2026. Whether you're researching how to buy RLI Corp. stock or you've just opened a brokerage account and are trying to time an entry, here are objective support levels and stop-loss references built from the RSI, MACD and ATR indicators.
RLI has spent most of the last two years in a broad decline, sliding from a peak near $90 in late 2024 to a 52-week low of $47.26 in May 2026 — and the last two months look like the first serious recovery attempt of that entire stretch. Price has climbed +31.0% off the low, reclaimed all three moving averages into a bullish alignment, and on-balance volume has flipped to accumulation on both timeframes. The caveats are real, though: relative strength versus the S&P 500 is still negative at −5.2%, MACD printed a dead cross on July 15, and the recent swing high at $62.52 sits directly overhead. This reads as a recovery being tested, not a confirmed new uptrend.
Snapshot all values from the July 24, 2026 close
| Item | Value | Reading |
|---|---|---|
| Close | $61.92 | −10.6% from 52w high / +31.0% from 52w low |
| 52-week high / low | $69.30 / $47.26 | Upper third of the yearly range |
| SMA 5 / 20 / 60 | $60.80 / $60.42 / $54.62 | Bullish alignment: Close > SMA5 > SMA20 > SMA60 |
| Bollinger (upper / mid / lower) | $63.28 / $60.42 / $57.56 | Band width 9.47%; price in the upper half |
| aVWAP (90d, anchored Apr 24, 2026) | $54.28 | Price well above — recent buyers in profit |
| aVWAP (2y, anchored Jan 23, 2025) | $63.18 | Price below — longer-term supply overhead |
| RSI (14) | 60.6 | Bullish zone, cooled from an early-July tag of 70+ |
| Mansfield RS (vs the S&P 500) | −5.2% | Still underperforming, but rising (week −6.9 → −5.2) |
| MACD (12,26) | 1.48 / signal 1.66 / hist −0.18 | Dead cross on Jul 15 — momentum cooling |
| ADX (14) | 27.2 | Strong trend (above the 25 threshold) |
| ATR (14) | $1.87 (3.0% of price) | Moderate volatility; basis for stop sizing |
| OBV | 2y: early accumulation (flat) / 90d: accumulation (rising) | Above its MA20 on both timeframes |
| Volume vs 20-day avg | 1.34× | Above average on the latest advance |
| 1× / 2× ATR stop | $60.06 / $58.19 | Objective invalidation references |
① Price & Moving Averages
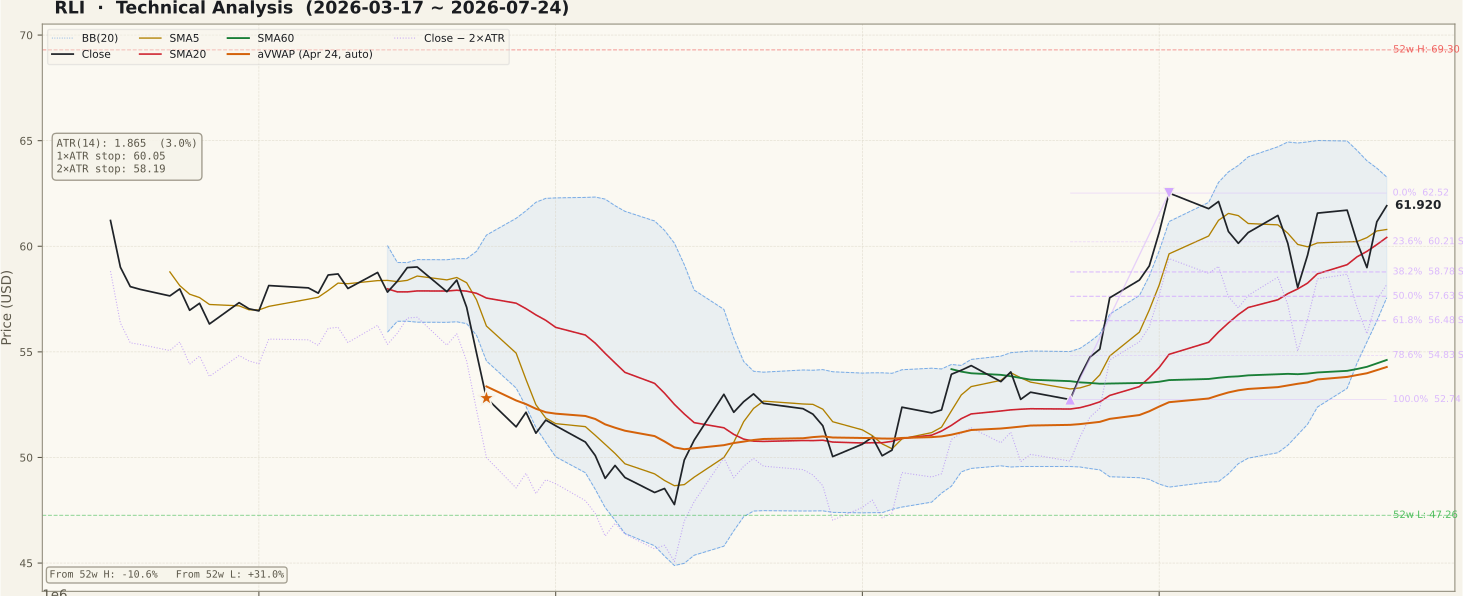
The two-year chart is the essential context: RLI topped near $90 in December 2024 and then spent roughly eighteen months making lower highs and lower lows, bottoming at $47.26 in May 2026. What has changed in the last two months is structural. Price staged a V-shaped rebound off that low, climbed back through the 60-day average, and now sits at $61.92 with a full bullish stack — Close above SMA5 ($60.80), above SMA20 ($60.42), above SMA60 ($54.62), all three rising. On the 90-day frame the July 2 swing high at $62.52 was briefly exceeded mid-month before price pulled back and re-approached it; that level and the upper Bollinger Band at $63.28 form the immediate ceiling. Below, the 23.6% retracement of the June–July swing at $60.21 overlaps the 20-day average and the mid-band near $60.42, making the $60.20–$60.42 zone the first meaningful support shelf. A recovery this young still lives underneath the old downtrend — the 52-week high at $69.30 is 10.6% away and the two-year picture remains a sequence of lower highs until proven otherwise.
② Volume

Friday's session traded 1.34× the 20-day average volume — an above-average print on an up day, which is the kind of confirmation a recovery needs. Looking across the 90-day window, the May decline was dominated by red volume bars, while the June–July advance shows green bars increasingly clustering at or above the average line, including a strong green surge into the July 24 close. This is a healthier volume profile than the typical low-volume drift higher that fails at the first resistance test. It is not overwhelming institutional-style volume, however — there is no 2×+ spike stamping the breakout — so treat the confirmation as adequate rather than emphatic. If price pushes through $62.52 on volume below average, that would be the classic unconfirmed breakout beginners get trapped by.
③ MACD

MACD is the clearest warning on this chart. The line sits at 1.48 against a signal of 1.66, and the histogram has been negative since a dead cross printed on July 15 (histogram −0.18). Both lines remain well above zero, which matters: a dead cross high above the zero line after a strong advance more often marks a pause or pullback within the move than a full reversal. The 90-day panel shows exactly that texture — a powerful MACD ramp through June, a peak in mid-July, and now a gentle rollover while price consolidates sideways-to-higher. The constructive resolution would be the histogram shrinking back toward zero and re-crossing as price holds the $60.21–$60.42 shelf. The bearish resolution would be the lines continuing to fall while price loses that shelf — momentum and price confirming each other lower.
④ RSI

RSI reads 60.6 — comfortably in the bullish half of the range without being stretched. The 90-day arc tells the recovery story in one line: an oversold basing period below 30 through much of May, a steady climb through the 50 midline in June, a push above 70 in early July, and a controlled cool-down since. Spending time above 70 and then settling into the 55–65 band is characteristic of an uptrend digesting gains, not a top by itself — in established uptrends RSI often oscillates between roughly 40 and 80. No divergence is flagged in the data, so there is no bearish non-confirmation to report between price and momentum at the highs. The level to watch is the 50 midline: holding above it on any pullback keeps the recovery's momentum regime intact, while a drop below would suggest the rebound is losing its engine.
⑤ Mansfield Relative Strength

Mansfield RS versus the S&P 500 stands at −5.2% — RLI is still underperforming the market, and that negative sign deserves respect no matter how good the price chart looks. The direction of travel, however, is strongly positive: a week ago RS was −6.9 (a +1.7 point improvement) and a month ago it was −17.4 (a +12.2 point improvement). In the negative zone a rising RS line means the stock is closing the gap with the index — improving, but not yet outperforming. The 90-day panel shows RS grinding up from below −30 toward the zero line without yet crossing it. The two-year panel adds sobering context: RLI has spent nearly the entire period since mid-2025 below zero. A cross above the zero line would be a genuine character change and one of the strongest confirmations this recovery could produce; stalling just below it is a common failure point.
⑥ ATR & ADX

ADX at 27.2 sits above the 25 threshold that marks a strong trend, and — critically — this strength has developed during the up leg, unlike the elevated ADX readings of May which accompanied the decline (ADX measures trend strength, not direction). ATR is $1.87, about 3.0% of price, with a notable uptick in the final sessions of the window — daily ranges are widening as price contests the $62 area, which often happens near decision points. That ATR feeds directly into position management: a 1× ATR stop sits at $60.06 and a 2× ATR stop at $58.19. With 3% daily swings normal for this stock, a stop placed inside roughly $1.87 of entry is likely to be hit by ordinary noise rather than by an actual change in trend — size positions accordingly rather than tightening the stop.
⑦ OBV (On-Balance Volume)

OBV supports the recovery on both timeframes, with a nuance worth noting. On the 90-day frame OBV is in outright accumulation — above its 20-day average with a rising slope and a divergence reading of +64.1% versus that average — and the panel shows OBV climbing to new window highs into the close, meaning volume is flowing in on up days faster than it leaves on down days. On the two-year frame the state is early accumulation: OBV is above its long MA (divergence +134.2%) but the slope is still flat, reflecting how much distribution from 2025 remains to be repaired. The two frames can legitimately disagree like this — short-term money is committed, long-term money is only beginning to turn. The bullish read stays valid as long as 90-day OBV holds above its average; a rollover there while price stalls under $62.52 would be an early distribution warning.
Bull Case vs Bear Case
Bull Case
- Full bullish MA alignment — Close > SMA5 > SMA20 > SMA60, all rising — for the first sustained stretch of the two-year window.
- +31.0% recovery off the May 52-week low of $47.26, with the 60-day average reclaimed and now sloping up.
- OBV in accumulation on the 90-day frame (rising, +64.1% above its MA20) and early accumulation on the 2-year frame — volume is backing the move.
- Mansfield RS improving fast: −17.4 a month ago, −6.9 a week ago, −5.2 now — the gap to the S&P 500 is closing.
- ADX 27.2 signals a strong trend that developed during the advance, and Friday's volume ran 1.34× the 20-day average on an up day.
- Price is well above the 90-day anchored VWAP at $54.28 — everyone who bought since the late-April anchor is in profit, reducing overhead sell pressure from recent buyers.
Bear Case
- MACD dead cross on July 15 with a negative histogram (−0.18) — short-term momentum is cooling right at resistance.
- Mansfield RS is still negative at −5.2% — RLI remains a market underperformer until the line crosses zero, and deep negative RS warrants caution even when other signals are bullish.
- Price sits below the 2-year anchored VWAP at $63.18 — the average long-term holder since January 2025 is still underwater, a natural source of overhead supply.
- The July 2 swing high at $62.52 has already capped the advance once; combined with the upper Bollinger Band at $63.28 and the 2y aVWAP, resistance is stacked at $62.5–$63.3.
- RSI tagged overbought above 70 in early July and has rolled back to 60.6 — the easiest part of the rebound may be behind.
- The two-year structure is still a downtrend of lower highs from $90; the 52-week high at $69.30 is 10.6% overhead and unchallenged.
Scenarios
| Scenario | Probability | Path | Trigger / Invalidation |
|---|---|---|---|
| Breakout continuation | ~40% | Price holds the $60.21–$60.42 shelf, clears $62.52, and presses through the $63.18–$63.28 resistance stack toward the mid-$60s. | Trigger: a daily close above $62.52 on volume at or above 1.3× average. Invalidated by a close back below $60.21. |
| Pullback and base | ~40% | The MACD dead cross plays out: price digests the rebound with a dip into $58.78–$60.21 (fib 38.2%–23.6%), holds, and builds a higher low. | Trigger: rejection at $62.52 with fading volume. Constructive while closes hold above $58.19; a higher low above the 38.2% level keeps the recovery intact. |
| Recovery failure | ~20% | Support at $60.21 and the 2×ATR stop both give way; price sinks back into the $56.48–$57.63 fib cluster and the rebound is reclassified as a bear-market rally. | Trigger: a daily close below $58.19 (2×ATR stop), especially on above-average red volume. That close invalidates the bullish setup outright. |
Key Levels
| Price | Role | Basis |
|---|---|---|
| $63.28 | Resistance | Upper Bollinger Band; 2-year aVWAP $63.18 sits in the same zone |
| $62.52 | Resistance | Fibonacci 0% — July 2 swing high of the June–July up swing |
| $61.92 | Current price | July 24, 2026 close |
| $60.42 | Support | SMA20 / Bollinger mid-band |
| $60.21 | Support | Fibonacci 23.6% retracement; 1×ATR stop $60.06 just below |
| $58.78 | Support | Fibonacci 38.2% retracement |
| $58.19 | Stop-loss | 2×ATR stop — objective invalidation (−6.0% from close) |
What to Watch
- The $62.52 test: a daily close above the July 2 swing high on above-average volume confirms the breakout scenario; repeated rejections there with fading volume favor the pullback path.
- Mansfield RS versus the zero line: a cross into positive territory would mark RLI's first sustained outperformance of the S&P 500 since mid-2025 — the single strongest confirmation available.
- MACD histogram direction: shrinking back toward zero while price holds $60.21–$60.42 defuses the dead cross; deepening negative bars alongside a lost shelf do the opposite.
- 90-day OBV vs its MA20: continued accumulation validates the move; an OBV rollover below its average while price stalls under resistance is an early distribution warning.
- The $58.19 line: any daily close below the 2×ATR stop ends the bullish setup — decide in advance how you would respond.
Conclusion
Past Analyses of This Stock same ticker · newest first
This analysis is an educational interpretation of chart data and is not investment advice. Probabilities and levels are subjective estimates; every investment decision, and its outcome, is your own responsibility. Technical signals describe what the chart has done, not what the company will do — always weigh fundamentals and your own risk tolerance before acting.
Two Week Swing · twoweekswing.com · 4,600+ stocks screened weekly