RingCentral, Inc.
$48.31 −3.6% from 52-week high ($50.14)
This analysis is based on closing-price data as of July 24, 2026. Whether you're researching how to buy RingCentral, Inc. stock or you've just opened a brokerage account and are trying to time an entry, here are objective support levels and stop-loss references built from the RSI, MACD and ATR indicators.
RingCentral spent most of the past two years underperforming the market, bottoming at $23.59 and grinding sideways until a large gap higher in February 2026 reset the trend. That recovery just went vertical: in the final two sessions of this week the stock surged roughly 28% from $37.66 to $48.31 on 4.1x average volume, closing within 3.6% of its 52-week high. A move this fast on this much volume usually has a news catalyst behind it, so this page reads the chart through two lenses at once — a genuine breakout with accelerating relative strength, and an extended spike that has not yet proven it can hold.
Snapshot all values from the July 24, 2026 close
| Item | Value | Read |
|---|---|---|
| Close | $48.31 | Above every moving average after a 2-session surge |
| 52-week high / low | $50.14 / $23.59 | −3.6% from the high · +104.8% off the low |
| SMA 5 / 20 / 60 | $40.98 / $40.52 / $41.06 | Price far above all three; averages were flat before the spike |
| Bollinger Bands (20) | $45.09 / $40.52 / $35.95 | Close sits above the upper band — statistically stretched |
| aVWAP 90d (May 8, 2026) | $41.07 | Recent buyers in profit |
| aVWAP 2y (Feb 20, 2026) | $39.84 | Holders since the February gap remain in profit |
| RSI (14) | 68.0 | Just below the 70 overbought line |
| Mansfield RS vs the S&P 500 | +35.3% | Outperforming and rising (prior week +15.6, prior month −0.7) |
| MACD (12,26,9) | 0.66 / signal 0.26 / hist +0.40 | Fresh golden cross on July 24 |
| ADX (14) | 13.3 | Ranging — the spike has not yet registered as a trend |
| ATR (14) | $2.83 (5.9% of price) | High volatility — size positions accordingly |
| OBV (90d / 2y) | Early accumulation / Early accumulation | Both above MA20; 2y OBV still negative in absolute terms |
| Volume vs 20-day avg | 8,920,400 vs 2,173,590 (4.10x) | Heavy participation confirms the move |
| 1x / 2x ATR stop | $45.48 / $42.65 | 2x ATR stop is −11.7% below the close |
① Price & Moving Averages
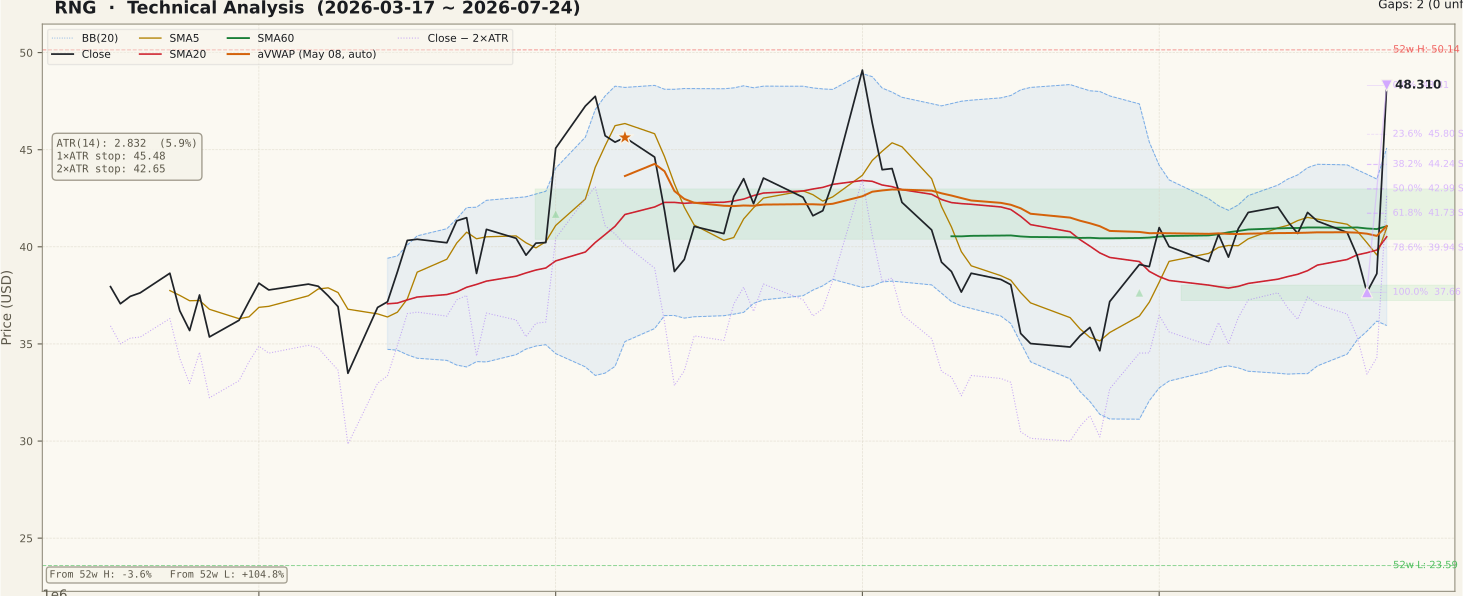
The two-year picture is a completed round trip: a decline into the August 2025 low near $23.59, months of base-building in the mid-$20s to low-$30s, then a decisive gap higher on February 20, 2026 that lifted the stock into a new $35–$50 range. Within the last 90 days price oscillated in that range, pulled back to $37.66 on July 22, and then launched to $48.31 in two sessions. The close now sits far above the 5-, 20- and 60-day averages ($40.98 / $40.52 / $41.06), which were essentially flat and braided together before the spike — a sign the move erupted out of consolidation rather than extending an existing trend. Note that the close is also above the upper Bollinger Band at $45.09: strong momentum, but statistically stretched, and moves that start with a bang often need to retest the band from above. All three unfilled gaps on the two-year chart ($34.36–$29.73, $28.03–$24.04, $23.46–$22.91) sit well below price and act as distant support, not overhead resistance.
② Volume

Friday printed 8,920,400 shares against a 20-day average of 2,173,590 — a 4.10x ratio, and the second straight session flagged as a volume spike on the chart. This is the single strongest argument that the breakout is real: low-volume breakouts are the classic trap for beginners, and this is the opposite case. The caveat cuts the other way — volume expansion of this magnitude alongside a ~28% two-session price move is the signature of a news or earnings catalyst, not of quiet technical accumulation. The chart can tell you participation was heavy; it cannot tell you what the news was or whether the market priced it correctly. Confirm the catalyst before treating this volume as an entry signal.
③ MACD

MACD (0.66) crossed above its signal line (0.26) in a golden cross dated July 24 — the very last bar — with the histogram flipping to +0.40. The cross occurred slightly above the zero line, which makes it a continuation-flavored signal rather than a deep-value early turn. Because the cross is only one session old and was produced by the same two bars as the price spike, it is confirmation of what price already did, not independent evidence. The 90-day panel shows several prior crosses in both directions during the range, a reminder that MACD whipsaws when ADX is low, as it is here. What would strengthen this signal is the histogram staying positive through next week while price digests the gain.
④ RSI

RSI stands at 68.0, hooking sharply higher from the mid-40s and now just under the 70 overbought threshold. No divergence is flagged in the data on either timeframe, so there is no bearish non-confirmation to report — momentum and price are rising together. Two readings are worth separating here. In a fresh breakout, RSI pushing into the 70s is normal and can stay elevated for weeks (strong trends embed overbought readings), so a high RSI alone is not a sell signal. But for anyone considering a new entry at $48.31, RSI near 70 immediately after a 28% burst means the easy part of the move has already happened; the reward-to-risk of chasing here is far worse than it was at the July 22 low.
⑤ Mansfield Relative Strength

Mansfield RS vs the S&P 500 prints +35.3% with a rising slope — firmly in outperform territory. The trajectory matters as much as the level: a week ago RS was +15.6 (a gain of roughly +19.7 points, so positive and accelerating), and a month ago it was slightly negative at −0.7. In other words, RNG has gone from market-neutral to a leadership-grade RS reading in about four weeks. On the two-year panel, RS spent most of 2024–2025 below zero and only crossed decisively positive after the February 2026 gap — the current reading extends that regime change rather than starting a new one. Sustained RS above zero while the price digests the spike would be the healthiest possible follow-through; an RS rollback toward zero would warn that the pop was a one-off.
⑥ ATR & ADX

ATR has jumped to $2.83, about 5.9% of price per day — high volatility that demands smaller position sizes and wider stops than a typical large-cap. ADX, by contrast, reads only 13.3, deep in ranging territory. That combination is characteristic of an event-driven spike: volatility explodes instantly, but ADX is a lagging trend-strength gauge and needs sustained directional movement before it rises. Remember that ADX measures strength, not direction — a rising ADX from here would confirm a new trend is forming, whichever way price resolves. The practical takeaway is that objective stops derived from ATR are wide right now: $45.48 at 1x ATR and $42.65 at 2x ATR, the latter almost 12% below the close.
⑦ OBV (On-Balance Volume)

Both timeframes tag OBV as early accumulation (OBV above its 20-day average, flat slope), but the details differ and both are worth stating. On the 90-day view OBV surged to 10,140,800, far above its 1,749,085 average — a 479.8% positive divergence driven almost entirely by the last two high-volume up sessions. On the two-year view OBV improved to −21,358,000 against a −29,749,715 average: above its MA, but still negative in absolute terms, meaning the cumulative selling of 2025 has not been fully repaired. The short-term money flow is clearly bullish; the long-term ledger says this recovery is still a work in progress rather than a completed institutional accumulation story.
Bull Case vs Bear Case
Bull Case
- Breakout confirmed by 4.10x average volume — the opposite of a thin, suspect move.
- Mansfield RS +35.3% and accelerating (+19.7 pts in a week) vs the S&P 500.
- Fresh MACD golden cross (July 24) with the histogram turning positive.
- Price above all moving averages and both anchored VWAPs ($41.07 / $39.84) — every recent buyer cohort is in profit.
- Within 3.6% of the 52-week high; all three unfilled gaps sit far below as support.
- OBV above its 20-day average on both timeframes — money flow supports the move.
Bear Case
- A ~28% two-session surge is almost certainly news-driven — the catalyst, not the chart, is in charge until verified.
- Close sits above the upper Bollinger Band ($45.09) and ~19% above the 20-day average — stretched.
- RSI 68.0 is at the edge of overbought right after a vertical move — poor entry reward-to-risk.
- ADX 13.3 says no established trend yet; spikes out of low-ADX ranges frequently retrace.
- Two-year OBV is still negative in absolute terms — long-term accumulation is incomplete.
- ATR at 5.9% of price makes stops wide; the 2x ATR stop is a full −11.7% away.
Scenarios
| Scenario | Probability | Path | Trigger / Invalidation |
|---|---|---|---|
| High consolidation, then 52-week-high test | ~45% | Price digests the spike above the shallow retracement zone ($45.80–$44.24), volume cools without heavy selling, then attacks $50.14. | Trigger: pullbacks hold above $44.24 on contracting volume. Invalidation: a close below $42.65 (2x ATR stop). |
| Deeper retracement into the support cluster | ~35% | Post-spike profit-taking drags price toward $42.99 (50%) and the $41.73 / $41.06 / $41.07 cluster (61.8% fib, SMA60, 90d aVWAP), where buyers get a second, better-priced decision point. | Trigger: close back inside the Bollinger Band with volume fading. Invalidation of the pullback-buy idea: failure to stabilize above $41.73. |
| Failed spike — full round trip | ~20% | The catalyst disappoints on second reading; price loses $42.65, momentum unwinds toward $39.94 (78.6%) and the $37.66 swing low. | Trigger: close below $42.65, especially on renewed high volume. A close below $37.66 would fully negate the breakout. |
Key Levels
| Price | Role | Basis |
|---|---|---|
| $50.14 | Resistance | 52-week high — the only overhead reference left |
| $48.31 | Current close | 0% of the swing ($37.66 → $48.31) — Friday, July 24 close |
| $45.80 | Support | 23.6% retracement of the up swing |
| $44.24 | Support | 38.2% retracement — first serious test of breakout demand |
| $42.99 | Support | 50% retracement of the up swing |
| $42.65 | Stop-loss | 2x ATR stop (−11.7% from close) — objective invalidation |
| $41.73 | Support | 61.8% retracement, clustered with SMA60 ($41.06) and 90d aVWAP ($41.07) |
What to Watch
- The catalyst itself. Identify the news behind the two-session, ~28% surge before acting — technicals alone cannot validate an event-driven move.
- Volume on the digestion days. Bullish: pullbacks on shrinking volume. Bearish: another 3–4x volume day that closes red.
- The $44.24–$45.80 zone. Shallow retracements that hold here keep the immediate breakout structure intact.
- Mansfield RS staying above +15–20. Leadership-grade RS holding up during consolidation would confirm the regime change; a slide toward zero would not.
- ADX turning up from 13.3. A rising ADX in the coming weeks would tell you the spike is graduating into a trend.
Conclusion
Past Analyses of This Stock same ticker · newest first
This analysis is an educational interpretation of chart data and is not investment advice. Probabilities and levels are subjective estimates; every investment decision, and its outcome, is your own responsibility. This stock just experienced an unusually large, likely news-driven price move — technical signals alone are not a sufficient basis to buy a stock undergoing a fundamental shock. Data as of the July 24, 2026 close.
Two Week Swing · twoweekswing.com · 4,600+ stocks screened weekly