PubMatic, Inc.
$12.73 −9.3% from 52-week high ($14.04)
This analysis is based on closing-price data as of July 17, 2026. Whether you're researching how to buy PubMatic stock or you've just opened a brokerage account and are trying to time an entry, here are objective support levels and stop-loss references built from the RSI, MACD and ATR indicators.
PubMatic spent most of the past two years in a broad decline — from above $20 in mid-2024 to a $6.15 low — and has since more than doubled, closing at $12.73, +107.0% off the 52-week low and −9.3% below the $14.04 high. The 90-day picture is a strong staircase uptrend (ADX 37.9) with relative strength firmly positive versus the Nasdaq Composite, but the week ended with a pullback: a bearish RSI divergence into the July 15 high, a fresh MACD dead cross on July 16, and a high-volume down day that closed below the 5- and 20-day averages. The useful lens here is a strong trend taking its first meaningful rest — where the pullback lands, and on what volume, matters more than the dip itself.
Snapshot all values from the July 17, 2026 chart run
| Metric | Value | Read |
|---|---|---|
| Close | $12.73 | Below SMA5 & SMA20 after the pullback bar; above SMA60 |
| 52-week high / low | $14.04 / $6.15 | −9.3% from the high · +107.0% off the low |
| SMA5 / SMA20 / SMA60 | $13.48 / $12.91 / $11.35 | Averages still stacked bullishly; price probing SMA20 |
| Bollinger (upper / mid / lower) | $14.71 / $12.91 / $11.12 | Band width 27.79% — volatility elevated |
| aVWAP (2y anchor, Nov 11, 2025) | $9.32 | Long-horizon buyers well in profit |
| aVWAP (90d anchor, May 11, 2026) | $11.54 | Swing-horizon buyers also in profit |
| RSI(14) | 50.9 | Bearish divergence flagged into the July 15 high |
| Mansfield RS (vs the Nasdaq Composite) | +25.7% | Outperforming; +18.5 pts above a month ago, −3.6 pts below last week |
| MACD (12,26,9) | 0.55 / signal 0.63 | Dead cross July 16; histogram −0.08 |
| ADX(14) | 37.9 | Strong trend (strength, not direction) |
| ATR(14) | $0.56 (4.39%) | Sizeable daily range for position sizing |
| OBV (2y) | Early distribution | Below its MA20 (−0.14%), flat slope |
| OBV (90d) | Improving | Below its MA20 (−0.17%) but rising |
| Volume (last / 20-day avg) | 835,600 / 558,245 | 1.5× average on the down day |
| 1× / 2× ATR stop | $12.17 / $11.61 | Objective invalidation references |
① Price & Moving Averages
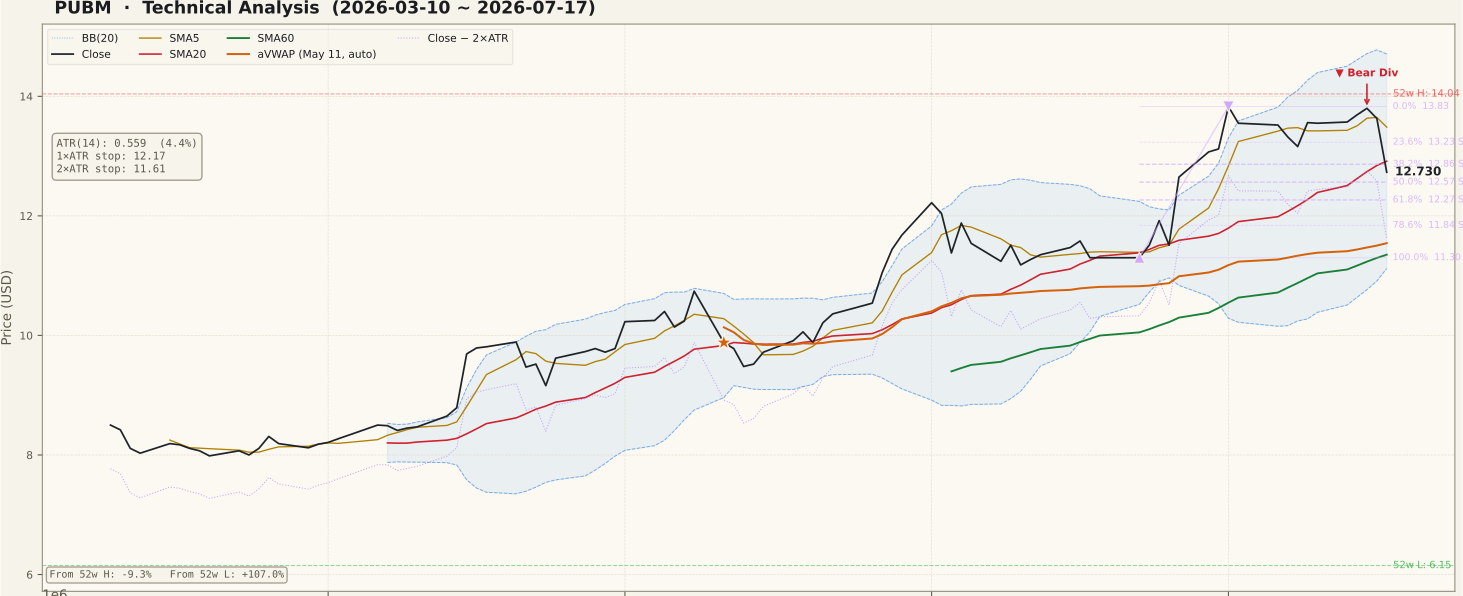
The 90-day chart is a textbook staircase: higher highs and higher lows from roughly $8 in March to the $13.83 swing high on July 1, with the 5-, 20- and 60-day averages stacked in bullish order beneath price for most of the run. Friday changed the near-term tone — the close at $12.73 fell back through SMA5 ($13.48) and finished just under SMA20 ($12.91), which also sits at the Bollinger midline. Measured against the June 22 to July 1 up swing ($11.30 to $13.83), the close now sits between the 38.2% retracement at $12.86 and the 50% level at $12.57 — still inside the zone where routine pullbacks in healthy trends typically stabilize. Below that, the 61.8% level at $12.27, the 78.6% level at $11.84 and the rising SMA60 at $11.35 form a deeper support stack, with the 90-day aVWAP at $11.54 in between. Overhead, the 2024 breakdown left a large unfilled gap between $14.32 and $18.74 (from August 9, 2024) directly above the $14.04 yearly high — meaningful supply the trend has not yet had to digest.
② Volume

Friday's decline printed 835,600 shares against a 558,245-share 20-day average — about 1.5× normal turnover on a down bar, which tilts the day toward genuine selling rather than a quiet drift. That said, 1.5× is elevated, not panic-grade; the 90-day window shows a handful of much larger yellow spike days (2×+) during the rally, several of which were accumulation days on advances. For a pullback to remain constructive, the pattern to look for is contracting volume as price digests, then expansion returning on up days. A second consecutive high-volume decline through the $12.57 area would be a clear escalation of the distribution case. With roughly $7 million in average daily dollar volume, liquidity is adequate for a small cap, though spreads can widen on fast days.
③ MACD

MACD crossed below its signal line on July 16 — a fresh dead cross with the MACD line at 0.55 versus the signal at 0.63 and the histogram just negative at −0.08. Context matters: the cross occurred well above the zero line after an extended advance, which is the profile of momentum cooling within an uptrend rather than a trend reversal — the two prior dead crosses in this 90-day window (mid-May and mid-June) both resolved into consolidations that the trend later absorbed. Even so, a dead cross from a lofty level is exactly how deeper retracements begin, so it should not be waved away. The constructive resolution would be the histogram bottoming shallowly and re-expanding within a couple of weeks; a MACD line that keeps falling toward zero would confirm the pullback has more room to run.
④ RSI

RSI has dropped to 50.9 — the midline — after the chart run flagged a bearish divergence: on June 1 price closed at $12.22 with RSI at 78.44, and on July 15 price made a higher high at $13.80 while RSI printed a lower high of 69.85. Rising price on fading momentum is a classic late-stage warning, and this one has already been partially "paid" by Friday's drop. Two cautions cut in opposite directions here. First, a divergence is a possibility of reversal, not a verdict — in strong trends they frequently resolve through time and sideways digestion rather than a deep decline. Second, the midline test is informative: in established uptrends RSI tends to find footing in the 40–50 band, so a hold and turn from here would suggest the trend's character is intact, while a slice down into the 30s would mark a change in behavior versus the entire March-to-July advance.
⑤ Mansfield Relative Strength

Mansfield RS versus the Nasdaq Composite stands at +25.7% — deeply in outperformance territory after crossing above zero in early June, ending more than a year below the line. The monthly trajectory is emphatic: RS was +7.2 a month ago, so the stock has added roughly 18.5 points of relative outperformance in four weeks — acceleration, not just persistence. The weekly read is softer: RS was +29.2 last week, so it has slipped about 3.6 points — outperformance that is still strongly positive but slowing at the margin, consistent with a stock resting after a sprint. For swing purposes this is one of the more supportive panels on the chart: pullbacks in positive, rising-slope RS names are statistically friendlier territory than dips in market laggards. A break of RS back below zero would remove that tailwind entirely.
⑥ ATR & ADX

ADX at 37.9 reads as a strong trend, and on this chart the trend it is measuring is the up move — but remember ADX measures strength, not direction, so if the pullback deepens, a high ADX will keep describing whatever move dominates. ATR is $0.56, or about 4.39% of price, and has been expanding through July: daily swings of half a dollar are normal here, so entries and stops sized for a quieter stock will get shaken out by noise. The mechanical references from the chart run are a 1×ATR stop at $12.17 and a 2×ATR stop at $11.61 — the latter sits below the 78.6% retracement ($11.84) but above the June 22 swing low ($11.30), a reasonable structural neighborhood for invalidation. With a 4.4% daily range, position size — not conviction — is the primary risk control.
⑦ OBV

The two timeframes disagree here, and both are worth stating. On the 90-day window OBV is tagged improving — it sits a hair below its 20-day average (−0.17%) but the slope is rising, and the cumulative line climbed steadily all the way through the rally, confirming that the advance was bought, not just marked up. On the 2-year window the tag is early distribution: OBV is below its MA20 (−0.14%) with a flat slope, meaning the long-horizon accumulation impulse has paused right as price stalls under the yearly high. Neither divergence is large — both readings are within a fifth of a percent of their averages — so this is a panel on a knife's edge rather than a loud warning. If OBV rolls decisively below its average on both timeframes while price holds flat, that quiet supply would be the earliest tell that this pullback is more than a rest.
Bull Case vs Bear Case
Bull Case
- Mansfield RS +25.7% vs the Nasdaq Composite, up ~18.5 pts in a month — a genuine market leader since June
- Strong, established trend: ADX 37.9 with higher highs and higher lows across the full 90-day window
- Price above the rising SMA60 ($11.35) and above both aVWAPs ($11.54 swing / $9.32 long-term) — holders at both horizons are in profit, muting overhead-supply pressure from recent buyers
- The pullback has only reached the normal 38.2%–50% retracement zone ($12.86–$12.57) of the latest swing
- 90-day OBV still rising — volume confirmed the advance rather than diverging against it
- +107% off the 52-week low with the 20-day average still above the 60-day; one down day has not damaged the structure
Bear Case
- Confirmed bearish RSI divergence: price $12.22 → $13.80 higher high (Jun 1 → Jul 15) while RSI faded 78.44 → 69.85
- Fresh MACD dead cross on July 16, printed from a high level after an extended run
- Friday closed below SMA5 and SMA20 on 1.5× average volume — the heaviest-volume down day in weeks
- Weekly RS slipped 3.6 pts (29.2 → 25.7) — outperformance slowing at the margin
- 2-year OBV tagged early distribution (below its MA20, flat slope) right under the yearly high
- Heavy overhead: the $14.04 52-week high plus a large unfilled gap at $14.32–$18.74 from August 2024, with Bollinger width at an elevated 27.8%
Scenarios probabilities are subjective estimates
| Scenario | Probability | Path | Trigger / Invalidation |
|---|---|---|---|
| Constructive pullback holds the fib shelf | ~45% | Price stabilizes in the $12.86–$12.57 zone (38.2%–50% retracement) on contracting volume, RSI turns up from the 40s–50s, then retests $13.23 and the $13.83 swing high with $14.04 beyond. | Trigger: reclaim of $12.91 (SMA20) and then $13.23 on above-average volume. Invalidated by a daily close below $12.27 (61.8%). |
| Deeper retracement, trend intact | ~35% | The dead cross and divergence extend the decline through $12.57 toward the $12.27–$11.84 band (61.8%–78.6%), where the 90-day aVWAP ($11.54) and rising SMA60 ($11.35) reinforce support. A longer base builds before any new attempt at the highs. | Trigger: daily close below $12.57, especially on expanding volume. Invalidated for the downside if price reclaims $13.23 first. |
| Swing failure | ~20% | Selling accelerates through the 2×ATR stop at $11.61 and the $11.30 swing low, breaking the higher-low sequence. The 90-day structure flips to distribution; the next chart support of note is far lower, near the $7.61–$7.10 unfilled gap zone. | Trigger: daily close below $11.61, confirmed by a close below $11.30. This scenario invalidates the entire pullback thesis. |
Key Levels nearest to price, from the chart run
| Level | Role | Basis |
|---|---|---|
| $14.04 | Resistance | 52-week high; large unfilled gap $14.32–$18.74 (Aug 9, 2024) directly above |
| $13.83 | Resistance | July 1 swing high — 0% of the June 22 → July 1 up swing |
| $13.23 | 23.6% retracement | First fib shelf of the swing; now the first overhead test after Friday's drop |
| $12.91 / $12.86 | SMA20 · 38.2% retracement | Cluster with the Bollinger midline; price closed just beneath it |
| $12.73 | Current close | Between the 38.2% and 50% retracement levels |
| $12.57 | Support | 50% retracement — the midpoint of the swing and the pivotal near-term hold |
| $11.61 | 2×ATR stop | Objective invalidation, ~8.8% below the close; beneath 78.6% ($11.84), above the $11.30 swing low |
What to Watch
- The $12.86–$12.57 zone. A hold on shrinking volume keeps this a routine 38.2%–50% pullback; a high-volume close below $12.57 opens the deeper-retracement path toward $12.27–$11.84.
- Volume symmetry. After Friday's 1.5×-average down day, the trend needs down-day volume to contract and up-day volume to expand. Two heavy red bars in a row would escalate the distribution case.
- RSI at the midline. A turn back up from the 40–50 band preserves the uptrend's character; a drop into the 30s would be behavior this advance has not shown since March.
- OBV on both timeframes. The 90-day line is still rising while the 2-year line reads early distribution — whichever resolves first (both above or both below their MA20s) likely tips the balance.
- MACD histogram depth. A shallow trough and quick re-expansion mirrors the May and June pauses; a MACD line sliding toward zero says the rest period will be longer.
Conclusion
Past Analyses of This Stock same ticker · newest first
Two Week Swing · twoweekswing.com · 4,600+ stocks screened weekly