Paymentus Holdings, Inc.
$34.10 −13.4% from 52-week high
This analysis is based on closing-price data as of July 31, 2026. Whether you're researching how to buy Paymentus Holdings, Inc. stock or you've just opened a brokerage account and are trying to time an entry, here are objective support levels and stop-loss references built from the RSI, MACD and ATR indicators.
Paymentus spent most of the past year grinding lower, sliding from the upper $30s to a 52-week low of $20.11 in June 2026 — and then undid a year of damage in roughly six weeks. The July 31 close of $34.10 sits +69.6% above that low, the moving averages have restacked upward (SMA5 $34.26 > SMA20 $30.20 > SMA60 $25.55), MACD printed a golden cross on July 27, and Mansfield RS has climbed back above the zero line to +7.1% versus the S&P 500. The other half of the picture is that the move is stretched: RSI 69.2, Bollinger band width 34.49%, ATR running at 4.6% of price, and on-balance volume below its 20-day average on both timeframes. This reads as a powerful recovery that has not yet shown it can hold its gains — a stretched advance, not a quiet base.
Snapshot all values from the July 31, 2026 close
| Item | Value | Reading |
|---|---|---|
| Close | $34.10 | −13.4% from 52w high / +69.6% from 52w low |
| 52-week high / low | $39.38 / $20.11 | Upper third of the yearly range after a vertical recovery |
| SMA 5 / 20 / 60 | $34.26 / $30.20 / $25.55 | SMA5 > SMA20 > SMA60 rising, but Close slipped just under SMA5 |
| Bollinger (upper / mid / lower) | $35.41 / $30.20 / $25.00 | Band width 34.49% — extreme expansion |
| aVWAP (90d, anchored May 5, 2026) | $25.43 | Price far above — every buyer since the anchor is in profit |
| aVWAP (2y, anchored Nov 13, 2024) | $30.00 | Price above — long-term overhead supply cleared |
| RSI (14) | 69.2 | Just under overbought, cooling from a tag above 70 |
| Mansfield RS (vs the S&P 500) | +7.1% | Outperforming and accelerating (week −8.3 → +7.1) |
| MACD (12,26) | 2.48 / signal 2.02 / hist +0.47 | Golden cross on Jul 27, both lines far above zero |
| ADX (14) | 44.1 (2y frame 43.7) | Strong trend, well above the 25 threshold |
| ATR (14) | $1.59 (4.6% of price) | High volatility — basis for stop sizing |
| OBV | 2y: early distribution (−3.63% vs MA20, flat) / 90d: early distribution (−4.55%, flat) | Below its MA20 on both timeframes — volume is not confirming |
| Volume vs 20-day avg | 1.56× | Above average into the July 31 close |
| 1× / 2× ATR stop | $32.52 / $30.93 | Objective invalidation references |
① Price & Moving Averages
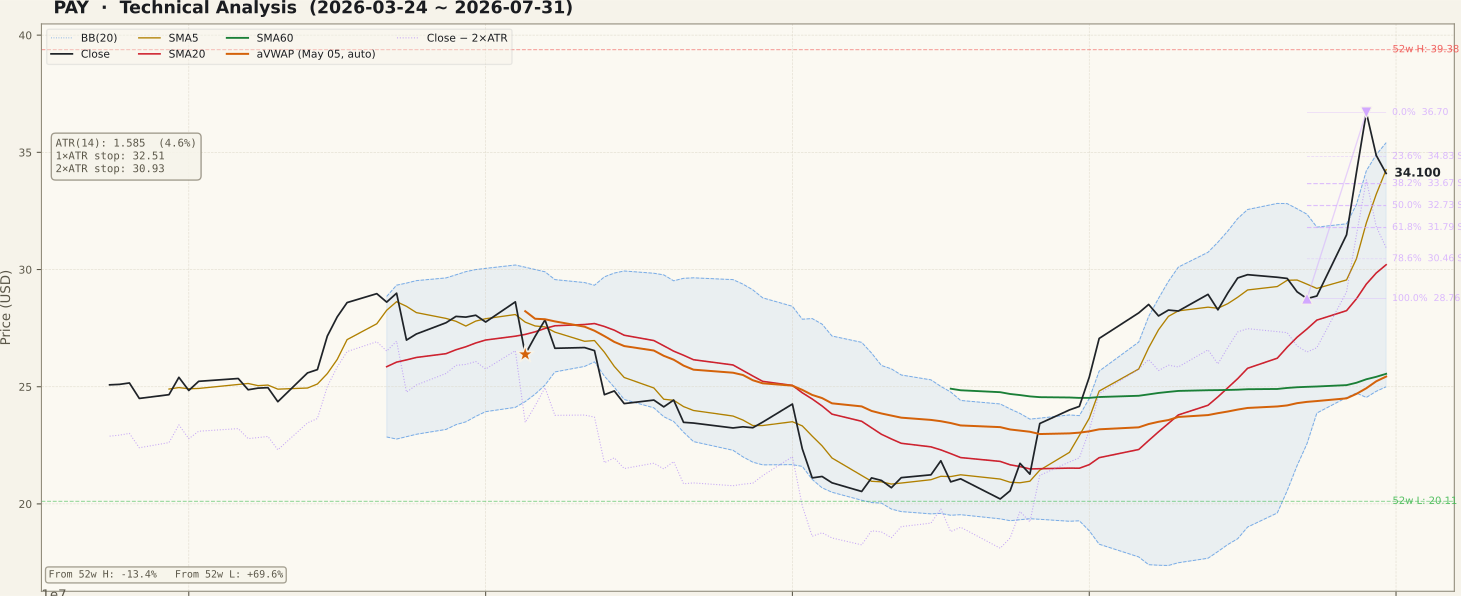
The two-year frame sets the stakes. Paymentus made a series of lower highs from the upper $30s through late 2025 and early 2026, then broke down into a 52-week low of $20.11 in June 2026 before reversing hard. The 90-day panel shows the shape clearly: a V-shaped launch off the June low, a near-uninterrupted climb through the 60-day average, and a spike to the July 29 swing high of $36.70 followed by a two-session fade to $34.10. Structurally the averages are now stacked upward — SMA5 $34.26, SMA20 $30.20, SMA60 $25.55, all rising — but the close is a fraction below SMA5 and below the 23.6% retracement of the July 23–29 swing at $34.83, so the very newest short-term signal is a loss of the first support shelf, not a breakout. Overhead, the upper Bollinger Band at $35.41 and the swing high at $36.70 form the immediate ceiling, with the 52-week high at $39.38 a further 13.4% away. Below, the fib ladder steps down through $33.67 (38.2%), $32.73 (50%), $31.79 (61.8%) and $30.46 (78.6%), and that last level sits in the same pocket as the 20-day average at $30.20 and the two-year anchored VWAP at $30.00 — the $30.0–$30.5 zone is the structural line where this recovery would still be intact. The two-year fib ladder is already stale for resistance purposes: its 0% anchor at $29.78 (July 17) was left behind by the subsequent run, so those levels now read as reference support, not overhead. One unfilled gap remains from August 2024 at $19.52–$21.31, far below and only relevant in a full round trip.
② Volume

The July 31 session traded 1.56× the 20-day average (1,570,800 shares against a 1,005,870 average), which is respectable participation into the close. The panel's dominant feature, however, is the single enormous bar in late June that dwarfs every other session of the two-year window — a one-day volume event several multiples of anything around it, immediately followed by the vertical leg that carried price from the low $20s toward the mid $30s. Volume of that character almost never comes from chart mechanics; it is the footprint of a news catalyst, and the 20-day average line has stair-stepped higher ever since. Two readings follow. The constructive one is that the base of this advance was built on genuine, heavy participation rather than a thin drift. The cautious one is that a move born from a single outsized session can retrace just as abruptly if the underlying reason disappoints on a follow-up event — and the chart alone cannot tell you which it is. Watch whether pullback sessions come on shrinking volume (healthy digestion) or on expanding red volume (supply returning).
③ MACD

MACD is the most straightforwardly bullish panel on the page: the line sits at 2.48 against a signal of 2.02, with a positive histogram of +0.47 and a golden cross dated July 27. Both lines are far above the zero line, near the highest readings of the entire two-year window, which is what a genuine momentum thrust looks like. The nuance a beginner should absorb is that a golden cross this high above zero is a continuation signal, not an early-cycle entry — the low-risk part of the cross came in late June when the lines turned up from beneath zero. From here the histogram is the tell: expanding green bars keep the thrust alive, while a rollover toward zero while price sits under $34.83 would mark the momentum peak of this leg. The panel also shows a brief dead cross in late July that was reversed within days, a reminder that at this altitude the signal line whipsaws easily.
④ RSI

RSI reads 69.2, a hair below the 70 line after spending most of July above it. The 90-day arc runs from readings near 30 in the June trough to a sustained overbought stretch through July and a spike toward the mid-70s at the swing high, followed by the current cool-down. Prolonged time above 70 is a hallmark of a strong trend rather than an automatic top — in powerful advances RSI can walk along the overbought band for weeks — but the first drop back below 70 after such a stretch is where trends most often pause. No divergence is flagged in the data on either timeframe, so there is no bearish non-confirmation between price and momentum at the highs to report; the peaks are simply not present in the divergence fields, and it would be wrong to infer one from the picture alone. The levels that matter next are 70 on the way back up (thrust resumed) and 50 on the way down (momentum regime broken).
⑤ Mansfield Relative Strength

Mansfield RS versus the S&P 500 stands at +7.1% — Paymentus is now outperforming the index, and the rate of change is the striking part. A week ago RS was −8.3 and a month ago −15.9, so the line has improved by +15.4 points in a week and +23.0 points in a month, with the zero-line crossing happening only in the past few sessions. In positive territory a rising RS line means accelerating leadership, and that quadrant — positive and accelerating — is the strongest of the four. Context from the two-year panel keeps it honest: RS spent from roughly mid-2025 to July 2026 below zero, bottoming near −40, so this is a fresh crossing after a long stretch of lagging rather than an established leadership record. The distinction matters, because first crossings are frequently retested. Holding above zero on the next pullback would be the single most meaningful confirmation available here.
⑥ ATR & ADX

ADX at 44.1 on the 90-day frame (43.7 on the two-year frame) is deep into strong-trend territory, roughly double the 25 threshold, and in this case the strength has built during the advance. Keep in mind ADX measures intensity, not direction — the same panel showed elevated readings during earlier declines. ATR is $1.59, or 4.6% of price, and the panel shows it ramping sharply in the final sessions as daily ranges widened around the $36.70 spike. That volatility drives position sizing directly: the 1× ATR stop sits at $32.52 and the 2× ATR stop at $30.93, which is 9.3% below the close. A stop placed closer than roughly $1.59 from entry will be taken out by ordinary daily noise in this stock, so the correct adjustment is a smaller position, not a tighter stop. High ATR also means slippage on entries and exits is materially larger than for a quiet stock.
⑦ OBV (On-Balance Volume)

OBV is the clearest counterweight to the bullish price action, and both timeframes agree. On the 90-day frame OBV is tagged early distribution: below its 20-day average by 4.55% with a flat slope. The two-year frame reads the same way — early distribution, 3.63% below its MA20, slope flat. The panels show why: OBV leapt with the June volume event, ran up alongside the July advance, then flattened and rolled slightly while price pushed to its highest levels of the window. Price making new swing highs while OBV stalls beneath its average is the textbook non-confirmation — it says the last leg of the advance was not accompanied by the same net buying pressure that started it. This is a warning, not a reversal: OBV lags at inflection points and a single strong up day can flip it back above its average. But until it does, the volume evidence sits with the bears while the price evidence sits with the bulls.
Bull Case vs Bear Case
Bull Case
- +69.6% recovery off the June 52-week low of $20.11, with SMA5 $34.26 > SMA20 $30.20 > SMA60 $25.55 all rising — the moving-average stack has fully flipped up.
- Mansfield RS crossed into positive territory at +7.1% versus the S&P 500 after improving +15.4 points in a week and +23.0 points in a month — positive and accelerating.
- MACD golden cross on July 27 with both lines near two-year highs (2.48 / 2.02) and a positive histogram of +0.47.
- ADX 44.1 marks an unusually strong trend, and it developed during the up leg rather than the earlier decline.
- Price is far above both anchored VWAPs — 90d $25.43 and 2y $30.00 — so buyers from both anchors are in profit and the overhead supply that capped 2025 rallies has been cleared.
- Participation is present: the July 31 session ran 1.56× the 20-day average volume, and the average itself has stepped up through the advance.
Bear Case
- OBV is in early distribution on both timeframes — below its MA20 by 4.55% (90d) and 3.63% (2y) with a flat slope — so volume is not confirming the newest highs.
- The close at $34.10 slipped below SMA5 $34.26 and below the 23.6% retracement at $34.83, the first shelf lost since the $36.70 spike.
- RSI 69.2 has just rolled back under 70 after a month-long overbought stretch, and ATR at 4.6% of price means ordinary noise is large.
- Bollinger width at 34.49% is an extreme expansion; bands this wide typically compress again, and compression after a vertical move usually comes through price.
- A gain of this size in about six weeks, launched by one outsized volume session, is catalyst-shaped — and the chart cannot tell you whether that catalyst is durable.
- Price is still −13.4% below the 52-week high of $39.38, and the two-year record shows repeated rallies stalling in the upper $30s.
Scenarios
| Scenario | Probability | Path | Trigger / Invalidation |
|---|---|---|---|
| Trend continuation | ~35% | Price reclaims $34.83, clears the upper band at $35.41 and the July 29 swing high at $36.70, then works toward the 52-week high at $39.38. | Trigger: a daily close above $36.70 on volume at or above the 20-day average, with OBV back over its MA20. Invalidated by a close below $32.73. |
| Digestion and higher low | ~40% | The advance cools into the $33.67–$32.73 fib band (38.2%–50%), volatility contracts, and a higher low forms while RS holds above zero. | Trigger: rejection under $34.83–$35.41 on fading volume. Constructive while daily closes hold above $30.93; losing $31.79 (61.8%) puts the whole leg in question. |
| Round trip of the spike | ~25% | OBV distribution wins out, price gives back the July run and slides through $30.93 toward the $30.46–$30.00 pocket where the 78.6% retracement, SMA20 and the two-year aVWAP converge. | Trigger: a daily close below $30.93 (2×ATR stop), especially on expanding red volume. That close invalidates the bullish setup outright. |
Key Levels
| Price | Role | Basis |
|---|---|---|
| $36.70 | Resistance | Fibonacci 0% — July 29 swing high of the current up swing |
| $35.41 | Resistance | Upper Bollinger Band (band width 34.49%) |
| $34.83 | Resistance | Fibonacci 23.6% retracement — shelf lost on the July 31 close; SMA5 $34.26 just below |
| $34.10 | Current price | July 31, 2026 close |
| $33.67 | Support | Fibonacci 38.2% retracement — first support below the close |
| $32.73 | Support | Fibonacci 50% retracement; 1×ATR stop $32.52 sits just under |
| $30.93 | Stop-loss | 2×ATR stop — objective invalidation (−9.3% from close); SMA20 $30.20 and 2y aVWAP $30.00 just below |
What to Watch
- OBV versus its 20-day average: a move back above the MA20 on both timeframes would repair the main non-confirmation; continued early distribution while price sits near the highs is the loudest warning on this chart.
- The $34.83–$35.41 band: reclaiming the 23.6% retracement and the upper Bollinger Band keeps the thrust alive; repeated rejections there define the top of a digestion range.
- Mansfield RS and the zero line: the crossing to +7.1% is days old — holding above zero through the first pullback would confirm real leadership rather than a spike artifact.
- Volume character on down days: shrinking volume on pullbacks reads as digestion; expanding red volume after a catalyst-driven run reads as supply returning.
- The $30.93 line: a daily close below the 2×ATR stop ends the bullish setup — decide in advance how you would respond, given that 4.6% ATR makes that distance about two average days.
Conclusion
Past Analyses of This Stock same ticker · newest first
This analysis is an educational interpretation of chart data and is not investment advice. Probabilities and levels are subjective estimates; every investment decision, and its outcome, is your own responsibility. Technical signals describe what the chart has done, not what the company will do — always weigh fundamentals and your own risk tolerance before acting.
Two Week Swing · twoweekswing.com · 4,600+ stocks screened weekly