NMI Holdings Inc
$44.30 −5.2% from the 52-week high · +27.2% from the 52-week low
This analysis is based on closing-price data as of July 31, 2026. Whether you're researching how to buy NMI Holdings Inc stock or you've just opened a brokerage account and are trying to time an entry, here are objective support levels and stop-loss references built from the RSI, MACD and ATR indicators.
Two years of data show a stock that spent most of 2025 chopping sideways in a broad $34–$43 band and then, from the early-June low at $35.42, put together its cleanest advance of the period. The close at $44.30 sits above every moving average in the stack — SMA5 $43.82, SMA20 $42.27, SMA60 $39.30 — with ADX at 30.40 confirming a trending, not drifting, market, and Mansfield RS has crossed from −4.72 a month ago to +5.80% today. The complication is that the 52-week high of $46.74 was printed on this very session and the close finished 5.2% beneath it, while RSI logged a lower high against a higher price high. This page reads the advance as intact but stretched, and frames the levels that would confirm or break that reading.
Snapshot all values as of the Jul 31, 2026 close
| Metric | Value | Read |
|---|---|---|
| Close | $44.30 | Above every moving average in the stack |
| 52-week high / low | $46.74 / $34.84 | −5.2% from the high · +27.2% from the low |
| SMA5 / SMA20 / SMA60 | $43.82 / $42.27 / $39.30 | Bullish alignment: Close > 5 > 20 > 60 |
| Bollinger (20) | upper $44.50 · mid $42.27 · lower $40.05 | Band width 10.52% · close pinned to the upper band |
| aVWAP — 2y (anchor Nov 6, 2024) | $38.00 | Price 2 years' worth of buyers onside |
| aVWAP — 90d (anchor May 1, 2026) | $39.09 | Short-horizon buyers also onside |
| RSI(14) | 67.93 (2y) · 67.96 (90d) | Just under 70 · bearish divergence flagged |
| Mansfield RS vs the Nasdaq Composite | +5.80% | Outperform · rising (prev week +3.68 · prev month −4.72) |
| MACD(12,26,9) | 1.1528 / signal 1.0624 / hist +0.0904 | Golden cross Jul 28, 2026 · histogram thin |
| ADX(14) | 30.40 (2y) · 30.81 (90d) | Strong trend band (>25) |
| ATR(14) | $1.135 (2.56% of price) | Position-sizing and stop input |
| OBV — 2y / 90d | early accumulation, flat, +9.16% / accumulation, rising, +71.19% | Short horizon leads · long horizon still catching up |
| Volume | 858,800 vs 20-day avg 468,010 | 1.84x average on the final session |
| 1× / 2× ATR stop | $43.17 / $42.03 | 2× ATR stop sits 5.12% below the close |
① Price & Moving Averages
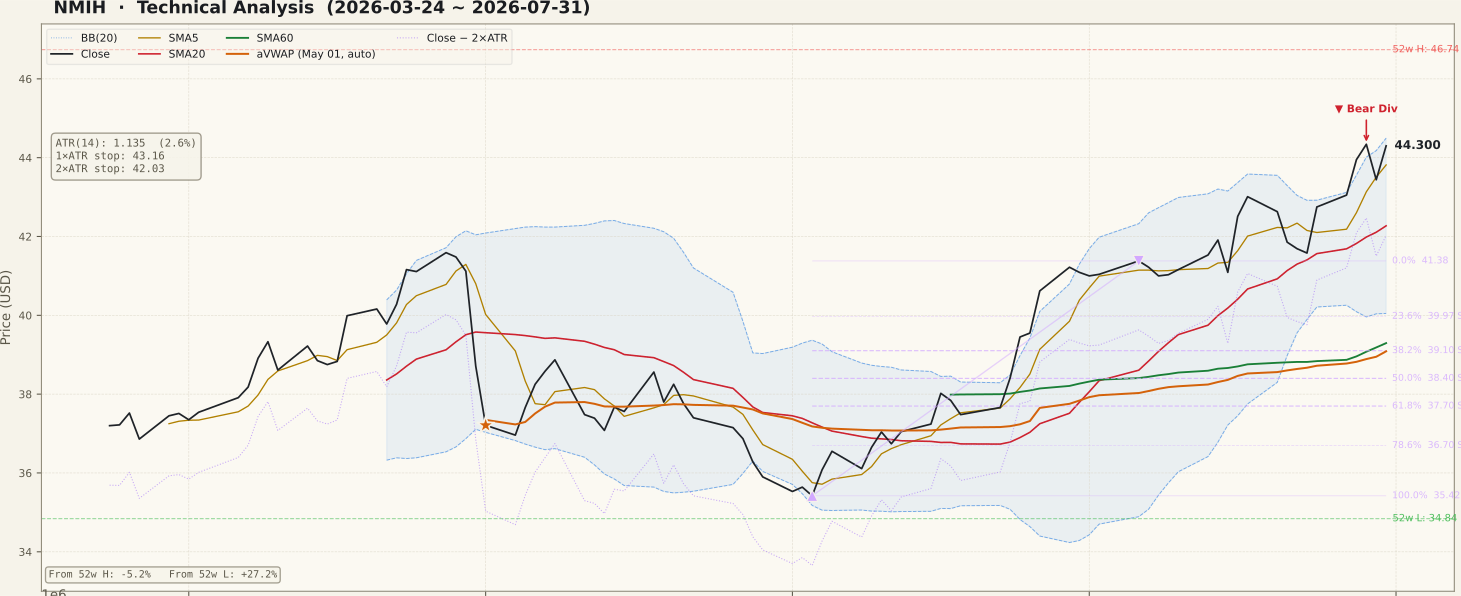
NMIH_price-90d-2026-08-02.svgThe moving-average stack is in textbook bullish order: close $44.30 above SMA5 $43.82, above SMA20 $42.27, above SMA60 $39.30, with all three curling upward on the 90-day view. Price is also riding the upper Bollinger Band at $44.50 with band width at 10.52% — the shape on the chart is band-walking, which reads as trend strength rather than an automatic reversal signal, but it does mean the stock is trading at the top of its own statistical range rather than in the middle of it. Both anchored VWAPs sit far below: $38.00 from the November 6, 2024 anchor and $39.09 from the May 1, 2026 anchor, so there is very little trapped supply overhead from either horizon.
The Fibonacci grid is anchored on the June 3 low at $35.42 and the July 6 high at $41.38 — an up-swing, so the levels below the anchor high are pullback support. Price has since cleared that $41.38 anchor entirely, which is why the whole retracement ladder ($39.97 · $39.10 · $38.40 · $37.70 · $36.70 · $35.42) now sits well beneath the market and only becomes relevant on a much deeper unwind. The single unfilled gap on the two-year chart is a support gap at $33.86–$34.87 from April 30, 2025, far below and not a working level today. The honest caveat: the 52-week high at $46.74 was registered during this same session and the close came in 5.2% under it, so the day's highest prices were not held into the bell.
② Volume

NMIH_volume-90d-2026-08-02.svgThe final session traded 858,800 shares against a 20-day average of 468,010 — a ratio of 1.84x, the heaviest participation of the recent advance and the sort of expansion that normally accompanies a genuine breakout attempt. On the 90-day panel the bars through June and July are visibly larger and greener than the drift of May, so the move up has not been a low-volume float. The nuance a beginner often misses is that volume expansion is directional only in combination with where price finished: heavy turnover on a session that closed well below its own high is as consistent with supply meeting demand as it is with accumulation. Treat the 1.84x reading as significance, not as direction, until the next few closes resolve it.
③ MACD

NMIH_macd-90d-2026-08-02.svgMACD stands at 1.1528 against a signal line of 1.0624, with the histogram positive at +0.0904 following a golden cross dated July 28, 2026. Because the cross happened well above the zero line rather than beneath it, this is a re-acceleration inside an existing up-leg, not the early turn off a base — the deeper, more powerful cross for this move was the one in mid-June near −0.6, visible on the 90-day panel. The histogram is the detail worth holding onto: at +0.0904 it is thin, and the bar heights on the chart have been shrinking through late July even as price advanced. That is momentum keeping pace with price rather than leading it.
④ RSI

NMIH_rsi-90d-2026-08-02.svgRSI(14) reads 67.93 on the two-year series and 67.96 on the 90-day series — just under the 70 line, which is elevated but not extreme. The generator flags a regular bearish divergence, and the two peaks are specific: June 29, 2026 at $41.22 with RSI 74.04, then July 29, 2026 at $44.34 with RSI 72.86 (the 90-day series reads 74.24 and 72.89 for the same two peaks). Price made a clearly higher high while RSI made a lower one, which is the definition of the pattern. The discipline here is not to over-read it: a divergence is a statement about the rate of the advance, not a top call, and the gap between 74.04 and 72.86 is a shallow one that a single strong session could erase. Divergences also stack and fail repeatedly inside strong trends — confirmation would require price itself to break structure, not just RSI to soften.
⑤ Mansfield RS

NMIH_rs-90d-2026-08-02.svgMansfield RS vs the Nasdaq Composite is +5.80%, above the zero line and rising. The trajectory matters more than the level: one week ago the reading was +3.68 and one month ago it was −4.72, so the weekly change is +2.12 and the monthly change is +10.53. With RS in positive territory and both changes positive, this is the accelerating-outperformance quadrant — the strongest of the four states. Context from the two-year panel keeps it honest: NMIH sat below zero for most of the stretch from late 2024 through June 2026, bottoming near −22 in June, so this outperformance is roughly two months old, not a long-established regime. The zero line is the level that matters — a return beneath it would remove the main structural argument for the stock.
⑥ ATR & ADX

NMIH_atr_adx-90d-2026-08-02.svgADX(14) is 30.40 on the two-year series and 30.81 on the 90-day series, comfortably in the "strong trend" band above 25 — and since price is above its averages, that strength is pointed upward. ADX measures conviction, not direction, so the same reading in a decline would be equally emphatic the other way. ATR(14) is $1.135, or 2.56% of price, and the 90-day ATR line turns sharply higher at the right edge of the panel, meaning the market has just become materially more volatile than it was through June. Wider daily ranges argue for smaller position sizes, not tighter stops: the 1× ATR reference at $43.17 sits only 2.56% below the close and would be clipped by ordinary noise, while the 2× ATR reference at $42.03 gives the setup 5.12% of room.
⑦ OBV

NMIH_obv-90d-2026-08-02.svgThe two horizons disagree in degree, and both readings belong on the page. On the 90-day series OBV is 3,610,900 against a 20-day average of 2,109,245 — tagged accumulation, above its MA20, slope rising, with a +71.19% divergence, and the panel shows OBV recovering from a deep negative trough in early June straight through to a new high. On the two-year series OBV is 17,897,500 against an MA20 of 16,395,845 — tagged early accumulation, above its MA20 but with a flat slope and only a +9.16% divergence. Read together: the buying since June is real and confirming the current leg, while on a two-year canvas that buying has only just returned the longer-horizon demand picture to a mildly constructive state. There is no bearish OBV non-confirmation here — price and OBV both made new highs together on the 90-day chart.
Bull vs Bear
Bull Case
- Full bullish moving-average alignment — close $44.30 > SMA5 $43.82 > SMA20 $42.27 > SMA60 $39.30, all rising.
- Mansfield RS at +5.80% vs the Nasdaq Composite, above zero and accelerating: +2.12 on the week, +10.53 on the month from −4.72.
- MACD golden cross dated Jul 28, 2026 with MACD 1.1528 over signal 1.0624 and a positive histogram.
- ADX 30.40 (2y) and 30.81 (90d) place the move in the strong-trend band rather than in a drift.
- 90-day OBV in accumulation — 3,610,900 above its 20-day average of 2,109,245, slope rising, +71.19% divergence.
- Price sits far above both anchored VWAPs ($38.00 from Nov 6, 2024 · $39.09 from May 1, 2026), so overhead supply from trapped buyers is thin.
Bear Case
- Regular bearish RSI divergence — price $41.22 (Jun 29) → $44.34 (Jul 29) while RSI fell 74.04 → 72.86.
- RSI at 67.93 leaves little room before the overbought zone, so upside from here is being bought at an elevated reading.
- Close $44.30 is pinned against the upper Bollinger Band at $44.50 with band width already expanded to 10.52%.
- The 52-week high of $46.74 was set on this same session, yet the close finished 5.2% beneath it — the day's push was not held.
- Two-year OBV is only early accumulation with a flat slope and a +9.16% divergence; the long-horizon demand picture lags the 90-day one.
- ATR has jumped to $1.135 (2.56% of price) at the right edge of the panel — wider ranges cut both ways, and 1.84x average volume on a session that closed well off its high is ambiguous, not confirming.
Scenarios
| Scenario | Probability | Path | Trigger / Invalidation |
|---|---|---|---|
| Trend continues — retest of the 52-week high | 45% | Shallow pullback holds the SMA5 $43.82 / SMA20 $42.27 zone, MACD histogram re-expands, price attacks $46.74 again. | Trigger: a daily close above the upper band at $44.50 on volume at or above the 20-day average. Invalidation: a close below $42.03. |
| Sideways digestion between $42.27 and $46.74 | 35% | The RSI divergence works itself off through time rather than price; closes stay contained under the upper band while SMA20 rises into the market. | Trigger: repeated closes capped below $44.50 with the histogram flattening. Invalidation: a decisive close above $46.74 or below $42.03. |
| Divergence resolves lower | 20% | Loss of the SMA20 / Bollinger mid at $42.27 opens the July 6 anchor high at $41.38 and then the 23.6% retracement at $39.97. | Trigger: a close below the 2× ATR reference at $42.03. Invalidation: reclaiming $44.50 on a closing basis. |
Key Levels nearest to price · descending
| Price | Role | Basis |
|---|---|---|
| $46.74 | Resistance | 52-week high — registered on the Jul 31 session; the close did not hold it |
| $44.50 | Resistance | Upper Bollinger Band (20) — band width 10.52% |
| $44.30 | Current | Jul 31, 2026 close |
| $43.82 | Support | SMA5 — first dynamic support of the current leg |
| $43.17 | 1× ATR reference | ATR $1.135 · 2.56% below the close — inside normal daily noise |
| $42.27 | Support | SMA20 and Bollinger mid — the same level from two methods |
| $42.03 | 2× ATR stop-loss reference | Objective invalidation — 5.12% below the close |
What to Watch
- The $44.50–$46.74 band. A daily close above the upper Bollinger Band, then above the 52-week high, would turn the failed intraday push into a confirmed breakout. Repeated rejections there build a ceiling instead.
- The $43.82 / $42.27 support pair. SMA5 first, SMA20 and the Bollinger mid together beneath it. Holding the shallower one keeps the leg intact; losing both moves the discussion to the 2× ATR reference at $42.03.
- MACD histogram at +0.0904. It is thin. Re-expansion would say the Jul 28 golden cross is doing real work; a flip negative would say the cross has stalled within a week of printing.
- RSI against the 72.86 peak. Reclaiming the July 29 high would cancel the divergence outright; a slide toward 50 would confirm that momentum, not just price, has turned.
- Mansfield RS and the zero line. The outperformance is roughly two months old after a long stretch below zero. A slip back under zero would remove the structural argument regardless of what price does in isolation.
Conclusion
Past Analyses of This Stock same ticker · newest first
This analysis is an educational interpretation of chart data and is not investment advice. Probabilities and levels are subjective estimates; every investment decision, and its outcome, is your own responsibility. A bottoming signal is not a buy signal, and a strong trend reading is not a recommendation. Where a stock has moved on a fundamental catalyst, technical signals alone are not a basis for buying — check the underlying event first.
Two Week Swing · twoweekswing.com · 4,600+ stocks screened weekly