NBT Bancorp Inc.
$52.45 −1.7% from 52-week high · +33.8% above 52-week low
This analysis is based on closing-price data as of July 17, 2026. Whether you're researching how to buy NBT Bancorp Inc. stock or you've just opened a brokerage account and are trying to time an entry, here are objective support levels and stop-loss references built from the RSI, MACD and ATR indicators.
NBTB has spent most of the past two years repairing damage — sliding from its late-2024 highs into a $39.20 fifty-two-week low and grinding sideways through 2025 — and 2026 has been the payoff: a stair-step uptrend that closed July 17 at $52.45, just 1.7% below the $53.33 fifty-two-week high. The setup carries fresh confirmation on almost every panel: a MACD golden cross on June 23, Mansfield relative strength that flipped from −5.5 to +9.8 versus the Nasdaq Composite in a month, and on-balance volume in accumulation on both timeframes. The tension is timing, not direction — RSI sits exactly at the 70 overbought line with price pressing the upper Bollinger Band, so the question is whether to buy strength here or wait for the chart to breathe.
Snapshot all values from chart JSON, July 17, 2026
| Item | Value | Reading |
|---|---|---|
| Close | $52.45 | −1.7% from 52w high, +33.8% above 52w low |
| 52-week high / low | $53.33 / $39.20 | pressing the top of the yearly range |
| SMA 5 / 20 / 60 | $51.64 / $49.79 / $46.94 | bullish stack, all three rising below price |
| Bollinger (upper / mid / lower) | $52.84 / $49.79 / $46.73 | close hugging the upper band (width 12.27%) |
| aVWAP 90d (anchor Apr 24, 2026) | $47.21 | price well above — recent buyers in profit |
| aVWAP 2y (anchor Nov 6, 2024) | $44.50 | long-term anchor far below price — little trapped supply |
| RSI(14) | 70.0 | at the overbought threshold on both timeframes; no divergence flagged |
| Mansfield RS vs the Nasdaq Composite | +9.8% | outperforming and accelerating (prev week +2.1, prev month −5.5) |
| MACD (12,26,9) | 1.31 / 1.10 / +0.21 | golden cross June 23, histogram still positive |
| ADX(14) | 33.7 | strong, established trend |
| ATR(14) | $1.10 (2.11%) | moderate daily range for position sizing |
| OBV | 2y: accumulation / 90d: accumulation | above a rising MA20 on both frames (+1,178% / +30.2% vs MA) |
| Volume vs 20-day avg | 1.47x | 615,100 shares vs a 418,430 average on the latest push |
| ATR stops (1x / 2x) | $51.35 / $50.24 | objective invalidation references |
① Price & Moving Averages
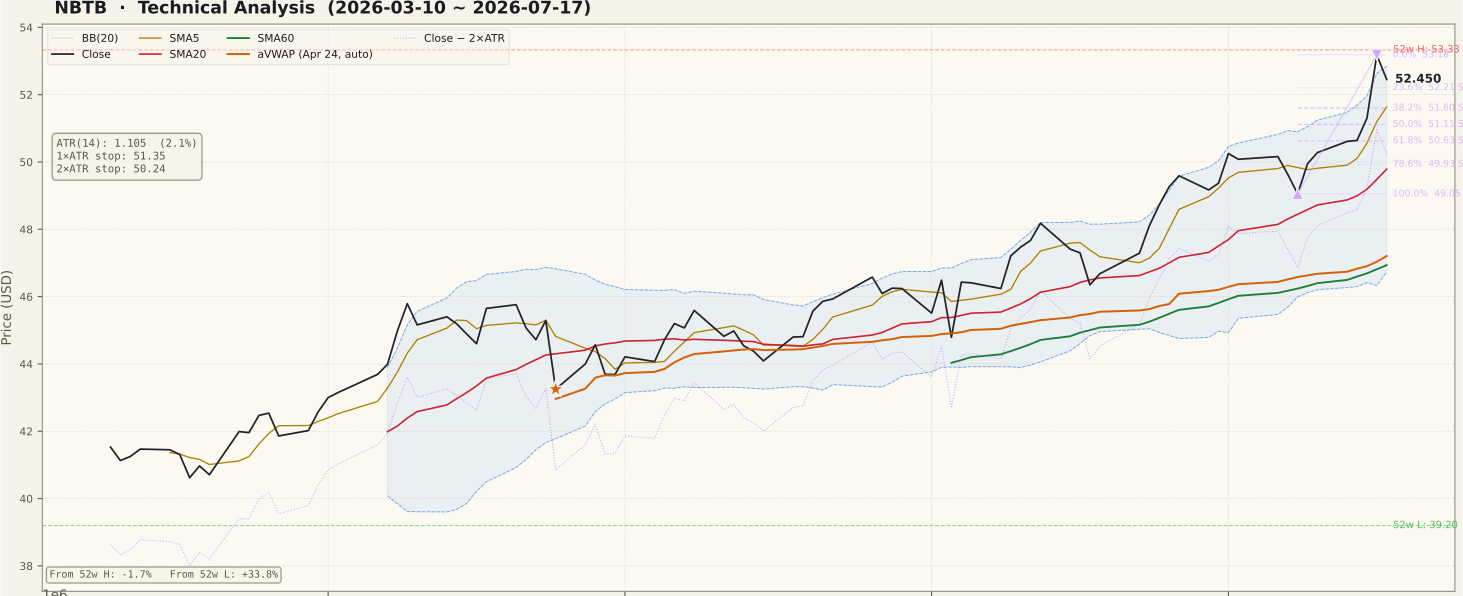
The two-year chart shows a completed round trip: highs near $51 in late 2024, a decline to the $39.20 fifty-two-week low, a long 2025 base in the low-to-mid $40s, and a steady 2026 recovery that has now carried price back above every prior shelf. On the 90-day frame the advance is a textbook stair-step — higher highs and higher lows from roughly $41 in March to $52.45 — with the close stacked above a rising SMA5 ($51.64), SMA20 ($49.79) and SMA60 ($46.94). Price is riding the upper Bollinger Band ($52.84), which in a trending tape signals strength rather than an automatic sell, but it also means short-term headroom is thin and the mid-band at $49.79 is the natural mean-reversion magnet. The July 8 to July 16 up-swing ($49.05 to $53.18) frames the retracement shelf: 23.6% at $52.21, 38.2% at $51.60 and 50% at $51.11 are the first supports a pullback would test. Both anchored VWAPs sit far below — $47.21 on the 90-day anchor and $44.50 on the two-year anchor — so the average buyer over both horizons is comfortably in profit, and there are no unfilled gaps overhead to act as resistance.
② Volume

The latest session traded 615,100 shares against a 418,430-share 20-day average — 1.47x — which is genuine confirmation for a close this near the highs, not a drifting, low-volume melt-up. The 90-day panel also shows the heaviest bars of the window clustering in late June and July, including two spike days flagged at more than twice the average, and most of the large bars land on up days. That pattern is consistent with the accumulation the OBV panel reports. One caution: mid-July is bank earnings season, so unusually heavy prints around these dates deserve a quick news check before you attribute them purely to chart-driven buying.
③ MACD

MACD printed a golden cross on June 23 and the signal has held since: the MACD line at 1.31 remains above the signal at 1.10 with a positive histogram of +0.21 that has been rebuilding through July. Importantly, this cross occurred well above the zero line — that is a trend-continuation signal inside an established uptrend rather than an early-cycle turn, which cuts both ways: the trend is proven, but the move is also mature. The practical tell from here is the histogram — continued expansion supports the breakout case, while a series of shrinking bars would be the first quiet warning that momentum is fading into resistance.
④ RSI

RSI(14) sits at 70.0 — exactly on the overbought boundary, and the reading agrees on both the 90-day and two-year frames. No divergence is flagged in the data: RSI has been making highs alongside price, which is healthier than the alternative, and the April episode on this same chart shows RSI tagging the low 70s and resolving through a sideways cool-off rather than a collapse. Still, overbought-in-an-uptrend is a statement about entry quality, not trend direction. A common beginner mistake is treating RSI 70 as an automatic sell — in strong trends it can persist — but the mirror-image mistake is initiating a fresh position at the boundary, where reward-to-risk is at its worst. Letting RSI cool toward the mid-50s while price holds the $51.60 area would be the constructive version of the next few weeks.
⑤ Mansfield Relative Strength

Mansfield RS versus the Nasdaq Composite reads +9.8% — outperforming, with a rising slope — and the rate of change is the striking part: a week ago the reading was +2.1 (a gain of +7.7 points), and a month ago it was −5.5 (a swing of +15.3 points). In quadrant terms this is positive-and-accelerating, the strongest state, and the two-year panel confirms the zero cross is anchor-free and real. Context matters, though: NBTB spent most of mid-2025 through early 2026 deeply negative on this panel, at times more than 20 points below the benchmark, so the leadership you see today is roughly one month old. Fresh leadership emerging from a long base is exactly what swing traders want to find — but it is also unproven, and a slip back below the zero line would remove one of the main pillars of this setup.
⑥ ATR & ADX

ATR(14) is $1.10, or 2.11% of price — a moderate daily range that makes position sizing straightforward: the 1x ATR reference sits at $51.35 and the 2x ATR stop at $50.24. ADX(14) reads 33.7 on the 90-day frame (33.1 on the two-year), comfortably above the 25 threshold that separates a genuine trend from noise, and the ADX line has been curling up through July as price accelerated. Remember that ADX measures strength, not direction — here it happens to confirm an uptrend, but the same reading in a decline would confirm the decline. The combination of moderate ATR and strong ADX is favorable for swing entries on pullbacks, because stops can be placed at structurally meaningful levels without being unusually wide.
⑦ OBV

Both timeframes agree: accumulation. On the 90-day frame OBV stands at 4,872,900 against a 3,743,450 MA20 (+30.2%), rising, and making new highs alongside price — there is no bearish non-confirmation where price prints highs that volume flow refuses to endorse. The two-year frame tells the bigger story: OBV spent late 2025 deeply negative and has ripped back above its MA20 only recently (the headline +1,178% versus the MA mostly reflects how small that MA base is after the crossover, so read it qualitatively rather than literally). In plain terms, roughly a year of distribution has been sharply unwound since June. The thing to watch is symmetry — if a pullback arrives on OBV that holds above its MA20, it is a dip being bought; an OBV break below the MA20 would suggest the July accumulation is being sold back out.
Bull Case vs Bear Case
Bull Case
- Bullish moving-average stack — close $52.45 above rising SMA5 ($51.64), SMA20 ($49.79) and SMA60 ($46.94).
- MACD golden cross June 23, printed above the zero line, with the histogram still positive at +0.21.
- Mansfield RS flipped from −5.5 to +9.8 vs the Nasdaq Composite in a month and is accelerating (+7.7 points in a week).
- OBV in accumulation on both timeframes, above a rising MA20 and confirming each new price high.
- ADX 33.7 marks a strong, established trend; price is band-walking the upper Bollinger with no unfilled gaps overhead.
- Latest push carried 1.47x average volume, and both anchored VWAPs ($47.21 / $44.50) sit far below — supply overhead is light.
Bear Case
- RSI(14) at 70.0 on both frames — fresh entries at the overbought boundary carry poor reward-to-risk.
- Close is pressed against the upper Bollinger Band ($52.84); the mean-reversion magnet at the mid-band is $49.79.
- Immediate resistance cluster overhead: the $53.18 swing high and the $53.33 fifty-two-week high.
- Relative-strength leadership is only about a month old after nearly a year below zero — promising but unproven.
- The July advance is steep and the nearest structural swing low ($49.05) sits well below — a failed breakout unwinds quickly.
- The 2x ATR stop at $50.24 is about 4.2% below the close — risk per share is elevated after the extension.
Scenarios
| Scenario | Probability | Path | Trigger / Invalidation |
|---|---|---|---|
| Breakout continuation | ~45% | Price holds the $51.60–$52.21 retracement shelf, then clears the $53.18–$53.33 resistance cluster and moves into open air above the 52-week high. | Trigger: a daily close above $53.33 on at least average volume. Invalidation: a rejection there followed by a close back below $51.60. |
| Sideways digestion, then resume | ~35% | RSI cools off the 70 line via time or a shallow dip into the $50.63–$51.60 Fibonacci shelf while the rising SMA20 ($49.79) catches up, then the trend reasserts. | Trigger: stalling under $53.18–$53.33 with shrinking volume. The constructive version holds $50.63 (61.8%) on a closing basis. |
| Failed breakout / deeper pullback | ~20% | Momentum fades at the highs, sellers press through the retracement shelf, and price tests $49.93 (78.6%) and the $49.05 swing low. | Trigger: a daily close below the $50.24 2x ATR stop — that close also invalidates the swing setup outright. |
Key Levels
| Price | Role | Basis |
|---|---|---|
| $53.33 | Resistance | 52-week high — the breakout trigger |
| $53.18 | Resistance | 0% of the swing — July 16 swing high |
| $52.45 | Current | Close, July 17, 2026 |
| $52.21 | Support | 23.6% retracement of the $49.05 → $53.18 swing |
| $51.60 | Support | 38.2% retracement — first meaningful pullback test |
| $51.11 | Support | 50% retracement, just below the 1x ATR reference ($51.35) |
| $50.24 | Stop-loss | 2x ATR stop — objective invalidation for the swing setup |
What to Watch
- A daily close above $53.33 on at least average volume — that confirms the breakout; a push above on weak volume is the classic trap to avoid.
- The $51.60–$52.21 retracement shelf on any pullback — buyers defending the 23.6–38.2% zone keeps the swing structure intact.
- Mansfield RS holding above zero — the leadership flip is one month old; a slip back negative would remove a core pillar of the setup.
- OBV versus its 20-day MA — a break below would signal the July accumulation being distributed back out.
- News behind the heavy mid-July volume — it is bank earnings season, so verify the catalyst rather than reading the spikes as purely technical.
Conclusion
Past Analyses of This Stock same ticker · newest first
This analysis is an educational interpretation of chart data and is not investment advice. Probabilities and levels are subjective estimates; every investment decision, and its outcome, is your own responsibility. All figures are derived from closing-price data as of July 17, 2026 and may be outdated by the time you read this.
Two Week Swing · twoweekswing.com · 4,600+ stocks screened weekly