Kforce, Inc.
$55.12 −9.2% vs 52-week high ($60.70)
This analysis is based on closing-price data as of July 24, 2026. Whether you're researching how to buy Kforce, Inc. stock or you've just opened a brokerage account and are trying to time an entry, here are objective support levels and stop-loss references built from the RSI, MACD and ATR indicators.
Over the two-year window, KFRC spent most of 2024–2025 in a persistent downtrend, bottoming near $24.49 in late 2025, then staged a powerful recovery — a large late-April gap higher, a rising SMA60 and a Mansfield RS reading of +48.2% vs the S&P 500 now define a strong uptrend that sits just 9.2% below the 52-week high. The short-term picture, however, has cooled: Friday printed a fresh MACD dead cross, the chart tool flags an RSI bearish divergence into the July 16 high, and OBV sits below its 20-day average. The working lens is a pullback within a strong uptrend — constructive as long as the $54.21–$52.81 retracement shelf holds, but the momentum warnings deserve respect.
Snapshot all values from the July 24, 2026 close
| Item | Value | Quick read |
|---|---|---|
| Close | $55.12 | −9.2% from 52w high, +125.1% off 52w low |
| 52-week high / low | $60.70 / $24.49 | Upper quarter of the yearly range |
| SMA 5 / 20 / 60 | $57.00 / $54.11 / $47.83 | Below SMA5, above SMA20 & SMA60 — pullback inside an uptrend |
| Bollinger (upper / mid / lower) | $61.06 / $54.11 / $47.15 | Width 25.7% — expanded bands, wide swings |
| aVWAP 90d (Apr 28 anchor) | $47.82 | Price well above — post-gap buyers in profit |
| aVWAP 2y (Nov 4, 2025 anchor) | $35.84 | Long-term holders from the base deep in profit |
| RSI(14) | 57.2 | Neutral-bullish, off overbought; bearish divergence flagged |
| Mansfield RS (vs S&P 500) | +48.2% | Outperforming; +20.0 pts vs a month ago, −8.7 pts vs last week |
| MACD (12,26) | 2.63 / signal 2.80 | Dead cross on Jul 24, histogram −0.16 |
| ADX(14) | 41.3 | Strong trend (strength, not direction) |
| ATR(14) | $2.23 (4.05%) | High daily range — size positions accordingly |
| OBV (90d / 2y) | 5.35M / −1.00M | Both below their 20-day MA, flat — early distribution on both frames |
| Volume (last / 20-day avg) | 384,200 / 252,975 | 1.52× average on the latest session |
| 1× / 2× ATR stop | $52.89 / $50.66 | Objective invalidation references |
① Price & Moving Averages
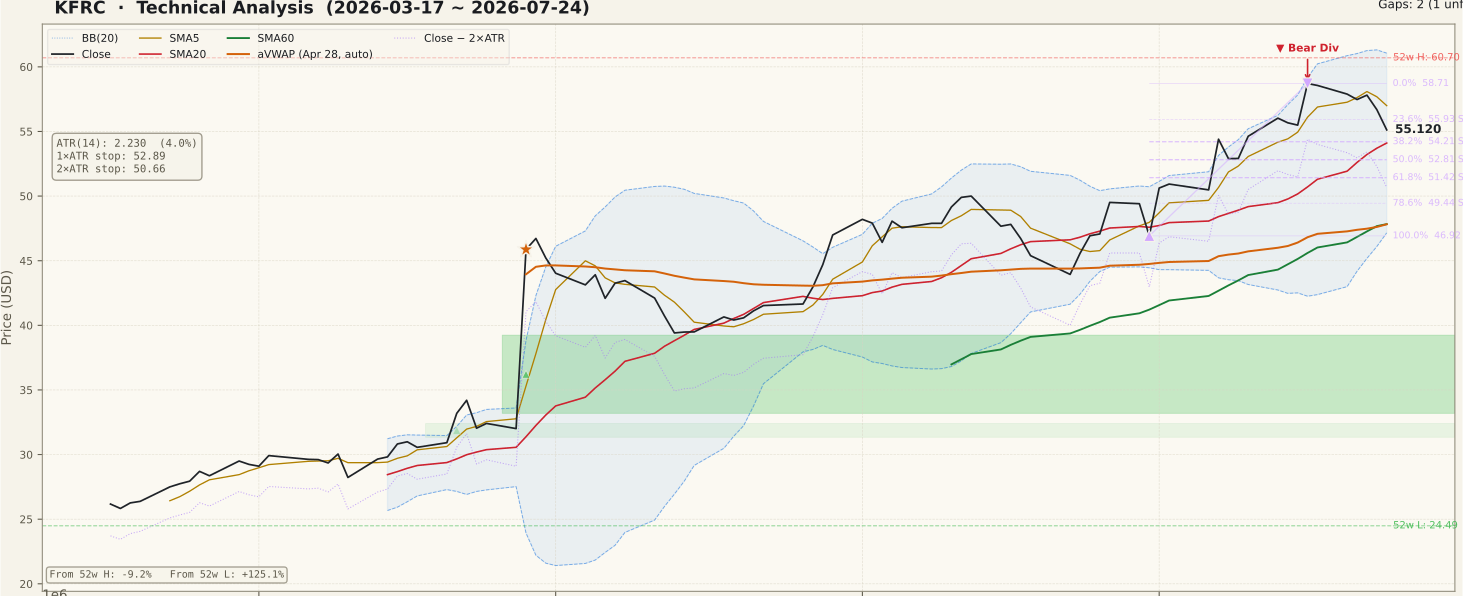
The 90-day structure is a staircase uptrend: a huge gap on April 28 lifted the stock out of the low-$30s, and since the June 30 swing low at $46.92 price has climbed to $58.71 (July 16) before easing back to $55.12. The close now sits below the 5-day average ($57.00) but above the rising 20-day ($54.11) and a steeply rising 60-day ($47.83) — the classic shape of a pullback inside an intact trend rather than a breakdown. Note the confluence just below price: the 38.2% retracement of the June–July swing at $54.21 lands almost exactly on the SMA20 at $54.11, making the $54.1–$54.2 zone the first meaningful test. The April 28 gap ($33.19–$39.24) remains unfilled far below and acts as deep structural support, while the Bollinger bands (width 25.7%) frame $61.06 above and $47.15 below — this is a wide-range tape, not a quiet one.
② Volume

The latest session traded 384,200 shares against a 252,975 20-day average — 1.52× normal — on a down day, which means the pullback is not happening on drying-up volume. That is worth taking seriously: healthy pullbacks ideally contract in volume, and expanding volume on red candles is how distribution starts. Context matters, though — the dominant volume events of the window (the April 28 spike toward 1.75M shares and the early-May follow-through) were buying events that launched the trend, and July's volume has been mixed green and red rather than one-sided selling. At roughly $14M of average daily dollar volume, KFRC is liquid enough for the volume signals to be meaningful, if thinner than large-cap names.
③ MACD

MACD printed a dead cross on July 24 — the line (2.63) slipped under its signal (2.80), turning the histogram negative at −0.16. Two things keep this from being an outright sell signal. First, the cross occurred high above the zero line, which typically marks a momentum pause within an uptrend rather than a trend reversal; the June 22 dead cross from a similar altitude resolved into a sideways drift, not a collapse. Second, the histogram is only barely negative — momentum has stalled, not cracked. Still, the pattern this year has been that high-altitude dead crosses preceded multi-week digestion phases, so fresh entries right after the cross have historically had poor timing. Watch whether the histogram deepens or curls back toward zero over the next few sessions.
④ RSI

RSI sits at 57.2 — comfortably neutral, cooled from the low-70s readings that accompanied the July high. The chart tool flags a bearish divergence: on June 12 price was $50.00 with RSI at 73.71, and on July 16 price made a clearly higher high at $58.71 while RSI reached only 73.20. The honest caveat is that the RSI gap between those two peaks is small (about half a point), so this is a mild non-confirmation rather than a textbook divergence — momentum kept pace with price almost, but not quite. A common beginner mistake is to treat any flagged divergence as a sell signal; a divergence is a possibility of reversal, and it needs price confirmation (a break of $54.21, for instance) before it means anything actionable. For now the constructive read is that RSI is resetting from overbought without reaching oversold — typical of pullbacks in strong trends.
⑤ Mansfield Relative Strength

Mansfield RS stands at +48.2% vs the S&P 500 — KFRC is not just rising, it is dramatically outperforming the benchmark, and it has held above the zero line since early May. The month-over-month move is emphatic: +20.0 points versus a month ago (28.3 → 48.2), confirming accelerating leadership on the longer view. The week-over-week reading, however, slipped −8.7 points (57.0 → 48.2) — outperformance in the positive zone that is slowing near-term, consistent with the price pullback. That combination — strongly positive level, rising monthly trajectory, softening week — is what a rest inside a leadership run usually looks like. It would turn concerning only if the weekly erosion continued for several weeks or RS threatened the zero line, neither of which is close today.
⑥ ATR & ADX

ADX at 41.3 reads “strong trend,” and here the trend it is measuring is the uptrend — but remember ADX gauges strength, not direction, so it will stay elevated for a while even if price rolls over. ATR at $2.23 is 4.05% of price: a 4% average daily range is genuinely high, which cuts both ways. It is why the stock could travel from $46.92 to $58.71 in eleven sessions, and it is also why stops must be wide — the 1× ATR reference sits at $52.89 and the 2× ATR stop at $50.66, about 8.1% below the close. If an 8% stop is more risk than a position plan allows, the correct response is a smaller position, not a tighter stop that normal daily noise would trigger.
⑦ OBV (On-Balance Volume)

OBV tells the most cautious story on the page. On the 90-day frame OBV (5.35M) has slipped below its 20-day average (5.93M) with a flat slope — tagged early distribution, with a −9.9% divergence from the average. The 2-year frame carries the same tag: OBV at −1.00M is below its average (−0.41M), and after a strong accumulation run from the November base, the cumulative line has stalled while price pressed to new recovery highs. That is a mild negative non-confirmation — volume flow is no longer leading price higher. It has not turned into aggressive selling (the slope is flat, not falling), but of the seven panels this is the one that most clearly says the easy stretch of the advance may be behind, and it is consistent with the higher-volume red sessions noted in the volume panel.
Bull Case vs Bear Case
Bull Case
- Mansfield RS +48.2% vs the S&P 500, up +20.0 pts month-over-month — clear market leadership.
- Price above rising SMA20 ($54.11) and SMA60 ($47.83); up +125.1% from the 52-week low with the trend structure intact.
- Pullback is shallow so far: holding above the 23.6–38.2% retracement band ($55.93/$54.21) of the June–July swing.
- 38.2% Fibonacci level ($54.21) and SMA20 ($54.11) form a tight support confluence just below price.
- ADX 41.3 confirms a strong, established trend; both aVWAPs ($47.82 / $35.84) far below price mean holders are in profit, limiting overhead sell pressure.
- Unfilled April 28 gap ($33.19–$39.24) marks a powerful demand event that continues to underpin the larger recovery.
Bear Case
- Fresh MACD dead cross on July 24 with the histogram turning negative — short-term momentum has rolled over.
- RSI bearish divergence flagged into the July 16 high ($58.71, RSI 73.2 vs 73.7 on June 12) — a mild momentum non-confirmation.
- OBV below its 20-day average on both the 90-day and 2-year frames (“early distribution”) — volume flow stopped leading price.
- Latest down session ran 1.52× average volume — the pullback is not on quiet volume.
- Weekly Mansfield RS change is −8.7 pts — relative strength is cooling near-term.
- ATR at 4.05% of price and 25.7% Bollinger width: the 2× ATR stop sits ~8.1% away, so a failed setup is expensive without disciplined sizing.
Scenarios
| Scenario | Probability | Path | Trigger / Invalidation |
|---|---|---|---|
| Constructive pullback, trend resumes | ~45% | Price stabilizes in the $54.11–$55.93 band (SMA20 + 23.6–38.2% retracement), volume contracts, then a push back through $57.00 (SMA5) toward $58.71 and the $60.70 52-week high. | Trigger: reclaim of $57.00 on above-average volume with the MACD histogram curling back positive. Invalidated by a daily close below $54.21. |
| Deeper retracement, then repair | ~35% | The dead cross and OBV distribution extend the dip toward the 50–61.8% retracement zone ($52.81–$51.42), where the deeper Fibonacci shelf and the rising SMA60 trajectory offer the next demand test. | Trigger: daily close below $54.21 on rising volume. Repair confirmed if price holds $51.42–$52.81 and RSI stays above ~40; invalidated below $50.66. |
| Swing failure / trend damage | ~20% | Distribution accelerates; price closes below the 2× ATR stop at $50.66 and the 78.6% level ($49.44), opening a full retest of the $46.92 swing low and undoing the July breakout. | Trigger: daily close below $50.66, especially on 2×+ volume. Below $46.92 the entire June–July up-leg is invalidated and the setup should be abandoned. |
Key Levels
| Price | Role | Basis |
|---|---|---|
| $60.70 | Resistance | 52-week high |
| $58.71 | Resistance | July 16 swing high — 0% of the swing |
| $55.93 | Support | 23.6% retracement of the Jun 30 → Jul 16 swing |
| $55.12 | Current | Jul 24 close |
| $54.21 | Support | 38.2% retracement + SMA20 ($54.11) confluence |
| $52.81 | Support | 50% retracement, near the 1× ATR stop ($52.89) |
| $50.66 | Stop-loss | 2× ATR below close — objective invalidation (~8.1% risk) |
What to Watch
- The $54.21 / $54.11 confluence (38.2% retracement + SMA20): the line between a routine pullback and a deeper retracement — watch closing prices, not intraday dips.
- MACD histogram direction: a curl back toward zero within a few sessions would defuse the July 24 dead cross; a deepening histogram confirms it.
- Volume on red vs green days: further 1.5×+ volume down days would upgrade “early distribution” to genuine distribution; shrinking volume on dips is the bullish tell.
- OBV vs its 20-day average: a recross above the average would neutralize the most cautious panel on the page.
- Weekly Mansfield RS: a second consecutive weekly decline, or any approach toward the zero line, would signal the leadership run is genuinely fading.
Conclusion
Past Analyses of This Stock same ticker · newest first
This analysis is an educational interpretation of chart data and is not investment advice. Probabilities and levels are subjective estimates; every investment decision, and its outcome, is your own responsibility. Technical signals alone are not a reason to buy a stock that has just experienced a major fundamental event — always check the underlying catalyst first.
Two Week Swing · twoweekswing.com · 4,600+ stocks screened weekly