Kelly Services, Inc.
$14.84 −10.1% from the 52-week high · +86.0% from the 52-week low
This analysis is based on closing-price data as of July 31, 2026. Whether you're researching how to buy Kelly Services, Inc. stock or you've just opened a brokerage account and are trying to time an entry, here are objective support levels and stop-loss references built from the RSI, MACD and ATR indicators.
Two years of chart history show a stock that spent most of 2025 grinding lower before basing near $7.98 and then staging a powerful recovery — KELYA now sits +86.0% above its 52-week low and just 10.1% below the $16.50 high printed in the last week of July. The move has been strong enough to push Mansfield RS to +24.3% against the Nasdaq Composite, a level this name has not seen in the entire two-year window. The immediate picture, however, is a first meaningful pause: price has slipped back under the 5-day line to close at $14.84, MACD crossed down on July 30, and a bearish RSI divergence was flagged into the high. The working lens is therefore a pullback inside an established uptrend — the structure is intact while price holds the rising 20-day line, and the objective invalidation is the 2×ATR reference at $13.70.
Snapshot all values as of the July 31, 2026 close
| Close | $14.84 · −10.1% from 52w high, +86.0% from 52w low |
|---|---|
| 52-week high / low | $16.50 / $7.98 |
| SMA 5 / 20 / 60 | $15.51 / $14.71 / $12.37 — close below SMA5, above SMA20 and SMA60 |
| Bollinger (20) | Upper $16.60 · Mid $14.71 · Lower $12.81 · width 25.76% |
| aVWAP — 2y | $10.16 (anchored Nov 6, 2025) — price well above |
| aVWAP — 90d | $12.02 (anchored May 7, 2026) — price above |
| RSI (14) | 57.00 (90d) / 56.99 (2y) — bearish divergence flagged |
| Mansfield RS vs the Nasdaq Composite | +24.28% — outperform (prev week +29.00, prev month +6.94) |
| MACD (12,26,9) | MACD 0.79 · Signal 0.89 · Histogram −0.10 — dead cross on Jul 30, 2026 |
| ADX (14) | 44.10 (90d) / 43.68 (2y) — strong trend |
| ATR (14) | $0.57 — 3.83% of price |
| OBV | 2y: early distribution (below MA20, flat, −6.92%) · 90d: improving (below MA20, rising, −7.66%) |
| Volume | 585,600 vs 20-day average 356,195 — 1.64× average |
| Stop references | 1×ATR $14.27 · 2×ATR $13.70 |
① Price & Moving Averages
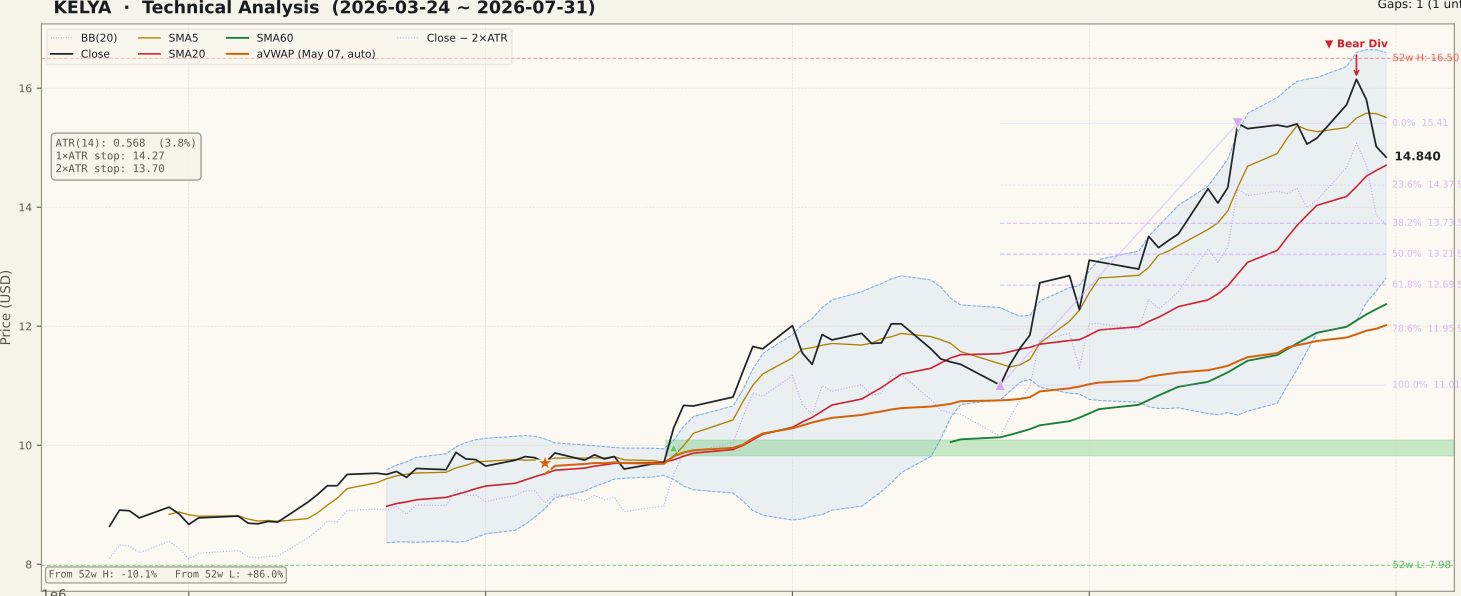
The moving-average stack is still the bullish order that matters — SMA5 $15.51 above SMA20 $14.71 above SMA60 $12.37, with all three rising on the 90-day panel. What has changed is where price sits inside that stack: the $14.84 close is below the 5-day line for the first time since the advance began, and is now resting almost exactly on the 20-day line, which doubles as the Bollinger midline at $14.71. Above price, the July swing high at $15.41 (the 0% anchor of the current up-swing) and the 52-week high at $16.50 are the two reference points that define whether this is a pause or a top; below, the 23.6% retracement at $14.37 and the 38.2% level at $13.73 are the first structural floors. Bollinger width of 25.76% is wide, which is normal after a directional run but also means a shallow-looking pullback can still travel several percent. The anchored VWAP references sit far below at $10.16 (2-year anchor, Nov 6, 2025) and $12.02 (90-day anchor, May 7, 2026) — buyers from both anchors are comfortably in profit, which historically reduces forced selling but says nothing about the next two weeks. Note also the two-year chart's unfilled gap between $19.19 and $21.28 from Nov 7, 2024: far overhead, but a reminder of how much ground was lost before this recovery started.
② Volume

The most recent session traded 585,600 shares against a 20-day average of 356,195 — 1.64× normal. That is the single most cautionary data point on the page, because the expansion came on a down day at the end of the pullback rather than on the push to the highs. Heavy volume into weakness is what distribution looks like in its early form; it is not conclusive on one bar, but it does raise the bar for the bullish reading. The 90-day panel also shows that the largest volume spikes of the quarter clustered in May and June, during the advance off the lows, which is the constructive pattern. One practical caveat: with a 20-day average near 356,000 shares, this is a moderately liquid mid-cap rather than a heavily traded one, so single-session volume readings carry more noise and wider spreads than they would in a large-cap name.
③ MACD

MACD registered a dead cross on July 30, 2026, with MACD at 0.79 beneath its signal at 0.89 and the histogram at −0.10. Context matters here: both lines remain far above the zero line, so this is a momentum cross inside an uptrend, not a trend reversal signature. Crosses that occur well above zero are typically consolidation signals — the fast average is simply cooling toward the slow one after a steep run. The histogram has only just turned negative, so the useful thing to watch is its depth: a shallow dip that curls back toward zero within a few sessions supports the pullback reading, while an expanding negative histogram that drags MACD toward the zero line would mark a genuine loss of trend energy.
④ RSI

RSI(14) reads 57.00 on the 90-day frame (56.99 on the two-year frame) — squarely neutral after several weeks spent above 70. The generator flags a regular bearish divergence: the first peak on July 16, 2026 paired a price of $15.41 with RSI 78.39, while the second peak on July 28, 2026 made a higher price of $16.15 on a lower RSI of 77.63. Higher price, lower momentum is the textbook shape, and it lines up with the sharp fade that followed. Two disciplines apply. First, a divergence is a warning about the rate of momentum, not a confirmed top — plenty of strong trends print one and keep going after a rest. Second, the divergence is already partly discounted: RSI has fallen roughly twenty points from the peak, so the overbought condition has been worked off. The level to respect is 50 — RSI holding above it through this pullback keeps the uptrend's momentum profile intact, while a decisive break below would mark a regime change.
⑤ Mansfield RS vs the Nasdaq Composite

Mansfield RS stands at +24.28% against the Nasdaq Composite, firmly in outperform territory. The two-year panel makes the transformation clear: this line sat below zero for essentially the entire 2024–2025 stretch, spending long periods near −40, and only crossed above zero in the past few months. Measured against the prior month's reading of +6.94, RS has gained +17.34 points — that is acceleration in positive territory, the strongest of the four quadrants. Measured against last week's +29.00, however, RS has given back −4.71 points, so the very short-term reading is positive-but-slowing. Both statements are true at once and together they describe exactly what a healthy pullback looks like: a stock that is still beating its index by a wide margin, easing off an extreme. What would matter is a sustained slide back toward zero, because RS leadership evaporating is usually the earliest of the warning signs, arriving before price structure breaks.
⑥ ATR & ADX

ADX(14) at 44.10 on the 90-day frame (43.68 on two years) is a strong-trend reading — well above the 25 threshold and near the highest levels of the entire two-year window. ADX measures strength, not direction, so it confirms that the recent move has been a genuine directional trend rather than chop; it does not promise that the direction continues. ATR(14) is $0.57, or 3.83% of price, and the 90-day panel shows it rising steadily through the advance — volatility has expanded alongside the trend. For position sizing that ATR is the practical input: a 1×ATR stop sits at $14.27 and a 2×ATR stop at $13.70, meaning a conventional two-ATR allowance is roughly 7.7% below the close. Anyone using a tighter stop than that in a stock moving nearly 4% a day should expect to be shaken out by ordinary noise.
⑦ OBV

The two timeframes disagree, and the disagreement is informative. On the 90-day frame OBV is tagged improving — below its 20-day average by −7.66% but with a rising slope, the signature of accumulation that has paused rather than reversed. On the two-year frame the tag is early distribution: OBV below its MA20 by −6.92% with a flat slope, and the absolute level still deeply negative at roughly −4.6 million after the long 2025 decline. Read together, the message is that buying pressure over the last quarter has been real but has not yet repaired the multi-year damage, and that the most recent sessions pulled OBV back beneath its own average on both frames. A quick reclaim of the OBV MA20 on the 90-day panel would confirm the pullback reading; continued erosion while price holds up would be a non-confirmation worth taking seriously.
Bull Case vs Bear Case
Bull Case
- Moving-average order is intact and rising: SMA5 $15.51 > SMA20 $14.71 > SMA60 $12.37.
- Mansfield RS at +24.28% vs the Nasdaq Composite — a two-year extreme, and up +17.34 points on the month.
- ADX 44.10 confirms a strong directional trend rather than a random drift higher.
- Price is far above both anchored VWAPs ($10.16 2-year, $12.02 90-day), so the buyer base is not underwater.
- The pullback has so far held the 20-day line and Bollinger midline at $14.71, the shallowest possible rest.
- 90-day OBV is tagged improving with a rising slope — accumulation over the quarter has not reversed.
Bear Case
- Regular bearish RSI divergence: price $15.41 → $16.15 while RSI fell 78.39 → 77.63 (Jul 16 → Jul 28).
- MACD dead cross on Jul 30 with the histogram at −0.10 and turning down.
- The pullback's latest session came on 1.64× average volume — expansion into weakness, not into strength.
- RS has already given back −4.71 points week-over-week from +29.00, so leadership is cooling at the margin.
- Two-year OBV still reads early distribution, below its MA20 and flat, with the absolute level deeply negative.
- ATR at 3.83% of price means an ordinary two-day swing can carry price through the first two support shelves.
Scenarios
| Scenario | Probability | Path | Trigger / Invalidation |
|---|---|---|---|
| Pullback holds, uptrend resumes | 45% | Price bases between the 20-day line at $14.71 and the 23.6% retracement at $14.37, MACD histogram curls back toward zero, then a push through the $15.41 swing high opens the $16.50 high. | Trigger: reclaim of $15.41 on above-average volume with RSI back above 60. Invalidation: daily close below $14.37. |
| Deeper retracement inside the trend | 35% | The 20-day line gives way and price works down toward the 38.2% level at $13.73 — which sits immediately above the 2×ATR reference at $13.70 — before the SMA60 at $12.37 and the 61.8% level at $12.69 come into view. | Trigger: daily close below $14.37 with volume above average. Invalidation: a same-week recovery back above the 20-day line at $14.71. |
| Divergence resolves as a top | 20% | The bearish divergence plays out fully: price loses $13.70, RSI breaks 50, RS rolls back toward zero, and the advance off the $7.98 low unwinds toward the 78.6% retracement at $11.95 and the swing origin at $11.01. | Trigger: sustained trade below the 2×ATR stop at $13.70. Invalidation: RSI holding above 50 while price defends $14.37. |
Key Levels
| Price | Role | Basis |
|---|---|---|
| $16.50 | Resistance | 52-week high, set in the last week of July 2026 |
| $15.51 | Resistance | SMA5 — the line price just lost |
| $15.41 | Resistance | Fibonacci 0% — the July 16 swing high anchoring the current up-swing |
| $14.84 | Current | Close of July 31, 2026 |
| $14.71 | Support | SMA20 and Bollinger midline — the first floor |
| $14.37 | Support | Fibonacci 23.6% retracement of the $11.01 → $15.41 swing |
| $13.70 | 2×ATR stop | Objective invalidation — 7.7% below the close, just under the 38.2% level at $13.73 |
What to Watch
- The 20-day line at $14.71. Holding it keeps this a routine rest inside an uptrend; losing it on a closing basis shifts the burden of proof to the $14.37 and $13.73 shelves.
- Volume character on the next three sessions. The pullback's latest bar printed 1.64× average volume on weakness — a repeat of that pattern is a very different signal from a quiet drift lower.
- MACD histogram depth. A shallow negative that curls back toward zero supports continuation; an expanding negative dragging MACD toward zero marks a real loss of trend energy.
- Mansfield RS direction. Still +24.28%, but −4.71 on the week. RS sliding toward zero would be the earliest warning, typically arriving before price structure breaks.
- The catalyst behind the late-July reversal. The move from the $16.50 high back to $14.84 was fast; before treating the pullback as purely technical, check whether a company or sector announcement drove it.
Conclusion
Past Analyses of This Stock same ticker · newest first
This analysis is an educational interpretation of chart data and is not investment advice. Probabilities and levels are subjective estimates; every investment decision, and its outcome, is your own responsibility. Chart data reflects closing prices through July 31, 2026 and does not account for events after that date.
Two Week Swing · twoweekswing.com · 4,600+ stocks screened weekly