Innovative Industrial Properties, Inc.
$64.44 −0.09% from 52-week high
This analysis is based on closing-price data as of July 10, 2026. Whether you're researching how to buy Innovative Industrial Properties stock or you've just opened a brokerage account and are trying to time an entry, here are objective support levels and stop-loss references built from the RSI, MACD and ATR indicators.
Innovative Industrial Properties closed at $64.44, essentially kissing its 52-week high of $64.50 after a steady five-month recovery from the February low at $44.58. The base-building has been orderly: a full bullish moving-average stack, relative strength versus the S&P 500 at +9.08 and rising, persistent OBV accumulation on both timeframes, and a fresh MACD golden cross on July 10. The hesitation points are ADX at just 14.06 — the trend still classifies as ranging, not strong — volume running below average at the very moment price tests the high, and an unfilled resistance gap at $66.46–$68.46 sitting directly overhead. A breakout attempt with strong sponsorship metrics but weak confirmation metrics: the next few sessions decide which set wins.
Snapshot July 10, 2026 close · from chart JSON
| Close | $64.44 |
|---|---|
| 52-week high / low | $64.50 (−0.09%) / $44.58 (+44.55%) |
| SMA 5 / 20 / 60 | $62.80 / $61.55 / $57.83 — bullish stack, price above all three |
| Bollinger Bands (20) | $58.42 – $61.55 – $64.68 · width 10.17% — close pressing the upper band |
| Anchored VWAP (90d) | $60.61 (anchor Jun 10, 2026) — price above |
| Anchored VWAP (2y) | $56.93 (anchor Dec 20, 2024) — price above |
| RSI (14) | 65.58 — firm but not overbought, mild bearish divergence flagged |
| Mansfield RS (vs the S&P 500) | +9.08, outperform, rising (prev week +8.39 · prev month +1.51) |
| MACD (12,26,9) | 1.42 vs signal 1.36, histogram +0.06 — golden cross on Jul 10, 2026 |
| ADX (14) | 14.37 — ranging; no strong trend reading yet |
| ATR (14) | $1.74 (2.70% of price) |
| OBV | 2y: accumulation, above MA20, rising (+12.16%) · 90d: accumulation, above MA20, rising (+75.98%) |
| Volume vs 20-day avg | 0.86× (347,745 vs 405,337) — below average |
| ATR stops | 1× $62.70 · 2× $60.96 (−5.4% from close) |
① Price & Moving Averages
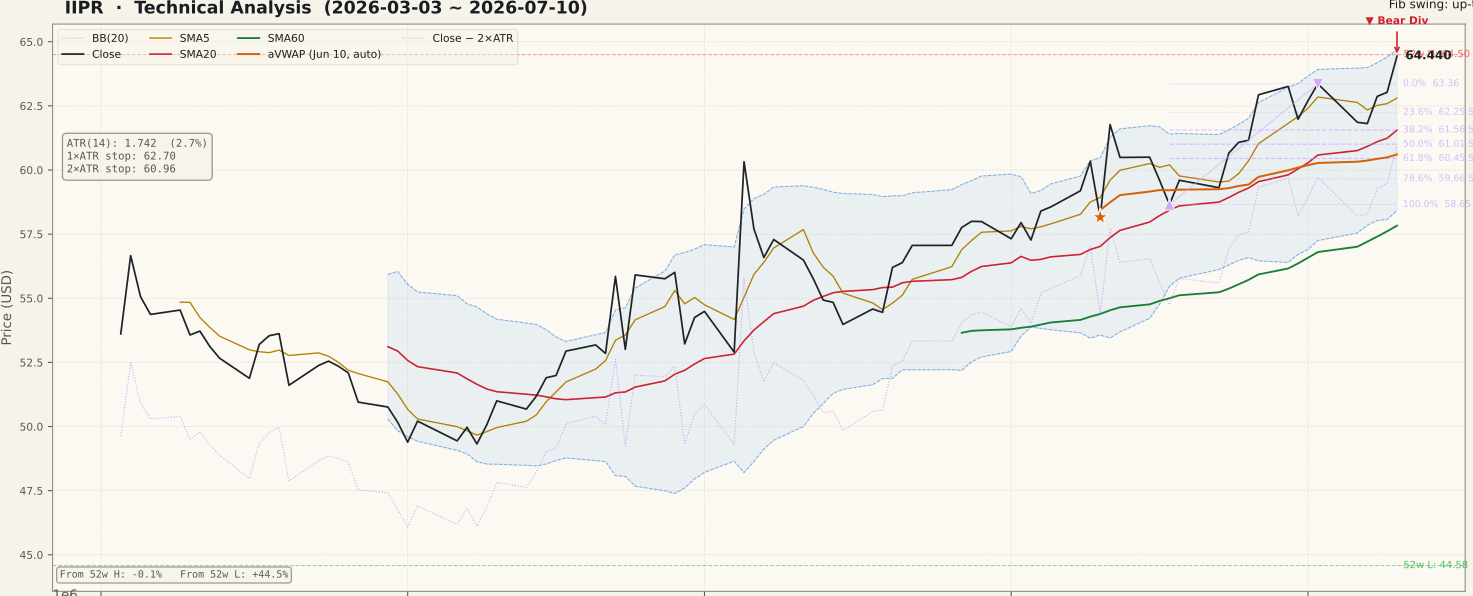
The two-year picture is a long decline — punctuated by big downside gaps in late 2024 that remain unfilled far overhead ($77.95–$95.29 and $113.49–$120.00) — followed by a bottom in February 2026 at the 52-week low of $44.58 and a patient, stair-stepped recovery since. On the 90-day view the advance is orderly: higher lows through May and June, a shallow pullback into the June 17 low at $58.65, and a push to $64.44 that now sits within a dime of the 52-week high. The moving averages are fully stacked — close above the 5-day ($62.80), 20-day ($61.55) and 60-day ($57.83) — and price is pressing the upper Bollinger Band at $64.68. The most important structural feature is directly above: the unfilled March 17, 2025 gap at $66.46–$68.46, which is both the logical first target on a confirmed breakout and the first supply zone likely to slow it.
② Volume

The latest session traded 347,745 shares against a 20-day average of 405,337 — a ratio of 0.86, below average right at the 52-week-high test. That is the single most common flaw in failed breakouts: price reaches the level, but participation does not. To be fair, quiet volume during the approach is acceptable, even typical, in a stock under steady accumulation; what matters is the volume on the day price actually clears $64.50. A push through the high on expanding volume (back above the 405K average, ideally well above) would validate the move, while a poke to new highs on another sub-average tape would raise false-breakout odds considerably.
③ MACD

MACD crossed back above its signal line on July 10, 2026 — 1.42 versus 1.36, histogram +0.06 — with both lines holding well above zero. As with any golden cross that occurs high above the zero line, this is a trend-continuation signal rather than a bottom call: momentum that had cooled during the late-June consolidation is re-engaging as price challenges the high. The cross is one day old, so treat it as provisional; a widening histogram over the next several sessions would confirm re-acceleration, while a quick re-flip below the signal line would suggest the consolidation needs more time.
④ RSI

RSI reads 65.58 — firm momentum, still below the 70 overbought threshold. The chart flags a bearish divergence, but it is a mild one: on June 11, 2026 price hit $61.77 with RSI at 66.86, and the new price high of $64.44 on July 10 came with RSI at 65.58 — a higher high in price against a slightly lower high in momentum, with barely more than a point of RSI slippage. Beginners often treat any divergence as a reversal signal; in practice a shallow divergence like this one frequently gets erased by a single strong up day. It earns real weight only if price stalls under $64.50 while RSI keeps sagging, or if a rejection closes back below the $63.36 swing high.
⑤ Mansfield Relative Strength

Mansfield RS versus the S&P 500 stands at +9.08 — well above the zero line, in outperform territory, with a rising slope. A week ago it was +8.39 (a further gain of +0.68 points), and a month ago just +1.51, so the month-over-month improvement is a substantial +7.56 points: the stock spent June transforming from a marginal outperformer into a clear leader, and the advance is still inching forward rather than rolling over. Positive, still-accelerating relative strength at a 52-week-high test is exactly the profile swing traders screen for, and it partially offsets the weak ADX reading — the stock is beating its benchmark even if the absolute trend has not yet registered as statistically strong.
⑥ ATR & ADX

ATR is $1.74, or 2.70% of price — a moderate range that keeps stop distances manageable for a REIT. The notable reading is ADX at 14.37, firmly in ranging territory (below 20). This is the main technical argument against calling the current move a powered breakout: the advance has been so gradual and low-drama that the directional-movement system does not yet register a trend at all. That cuts both ways — grinding, low-ADX advances can persist for months, and an ADX turning up through 20–25 from here would itself be a buy-side confirmation signal. The JSON provides two objective stops: 1×ATR at $62.70 and 2×ATR at $60.96, about 5.4% below the close and clustered with the 90-day anchored VWAP at $60.61 and the 61.8% retracement of the June–July swing at $60.45 — a natural invalidation zone.
⑦ OBV

On-balance volume is the quiet strength of this chart. On both timeframes OBV sits above its 20-day average with a rising slope and an accumulation tag — +12.16% divergence on the 2-year view and a pronounced +75.98% on the 90-day view. Unlike the flat session-volume ratio, cumulative volume flow says buyers have been steadily absorbing shares through the entire June–July consolidation, which is the footprint of accumulation rather than distribution ahead of a high. If the breakout through $64.50 comes, this OBV configuration is the reason to give it the benefit of the doubt; if OBV rolls below its MA20 while price stalls at the high, the accumulation case weakens materially.
Bull Case vs Bear Case
Bull Case
- Testing the 52-week high ($64.50) from below by only $0.06, with a full bullish SMA stack ($62.80 / $61.55 / $57.83) beneath.
- Mansfield RS +9.08 vs the S&P 500, rising, up +7.56 points month over month — a June leadership transformation.
- OBV in accumulation on both timeframes, above its MA20 with a rising slope (90d divergence +75.98%).
- Fresh MACD golden cross (Jul 10) with both lines well above zero — momentum re-engaging.
- RSI 65.58 is firm but not overbought — room above before the 70 threshold.
- Price above both anchored VWAPs ($60.61 / $56.93); no unfilled gaps below within the 90-day window.
Bear Case
- ADX 14.37 — the system still classifies this as a range, so the breakout lacks trend-strength confirmation.
- Volume 0.86× the 20-day average at the very test of the 52-week high — participation is missing so far.
- Mild bearish RSI divergence: price $61.77 → $64.44 while RSI slipped 66.86 → 65.58.
- Unfilled resistance gap directly overhead at $66.46–$68.46 (Mar 17, 2025) — the first supply zone after a break.
- Close pressing the upper Bollinger Band ($64.68) — short-term stretched at resistance.
- The 2-year chart is still a recovery inside a larger downtrend, with heavy unfilled gaps at $77.95–$95.29 and $113.49–$120.00 marking old supply.
Scenarios
| Scenario | Probability | Path | Trigger / Invalidation |
|---|---|---|---|
| Confirmed breakout | ~40% | Closes above $64.50 on expanding volume; the move then works into the $66.46–$68.46 gap, where the first real supply test occurs. | Trigger: close above $64.50 with volume >1× average and ADX turning up. Invalidation: close back below $63.36. |
| Consolidation below the high | ~40% | Low ADX and soft volume keep price ranging between the 20-day SMA ($61.55) and $64.50 while OBV accumulation continues — a higher base for a later attempt. | Trigger: rejection at $64.50 on another sub-average session. Constructive while closes hold above $61.55. |
| Rejection at the high | ~20% | The divergence confirms, price loses $62.70 and then the 2×ATR stop at $60.96, retesting the 90d anchored VWAP $60.61 / 61.8% retracement $60.45 cluster. | Trigger: daily close below $60.96. Below that cluster the June–July swing structure is broken. |
Key Levels
| Level | Role | Basis |
|---|---|---|
| $66.46 | Resistance | Bottom of unfilled Mar 17, 2025 gap ($66.46–$68.46) — first target/supply zone above the high |
| $64.68 | Resistance | Upper Bollinger Band |
| $64.50 | Resistance | 52-week high — the breakout line |
| $64.44 | Current | July 10, 2026 close |
| $63.36 | Support | July 2 swing high — 0% line of the June–July up swing |
| $62.70 | Support | 1×ATR stop reference |
| $60.96 | Stop-loss | 2×ATR stop (−5.4% from close), clustered with 90d aVWAP $60.61 and 61.8% retracement $60.45 |
What to Watch
- Volume on the break: a close above $64.50 needs volume back above the 405K 20-day average to be trusted; a quiet poke to new highs is suspect.
- ADX turning up: a rise through 20 from the current 14.37 would upgrade this from a grinding range to a confirmed trend.
- The $63.36 shelf: pullbacks that hold the July 2 swing high keep the immediate breakout structure intact.
- OBV vs its MA20: continued rising accumulation supports the move; a roll below the average while price stalls is the early warning.
- Behavior at the $66.46–$68.46 gap: if the breakout comes, watch whether the gap absorbs it or the move stalls at the gap's lower edge.
Conclusion
Past Analyses of This Stock same ticker · newest first
This analysis is an educational interpretation of chart data and is not investment advice. Probabilities and levels are subjective estimates; every investment decision, and its outcome, is your own responsibility. Technical signals alone are never a sufficient reason to buy a stock that has just moved on a fundamental catalyst — always check the news first.
Two Week Swing · twoweekswing.com · 4,600+ stocks screened weekly