GCM Grosvenor Inc.
$12.90 −10.3% vs 52-week high $14.38 · +38.7% above 52-week low $9.30
This analysis is based on closing-price data as of July 17, 2026. Whether you're researching how to buy GCM Grosvenor Inc. stock or you've just opened a brokerage account and are trying to time an entry, here are objective support levels and stop-loss references built from the RSI, MACD and ATR indicators.
GCMG spent most of the past year underperforming: after topping out near $14.38 in early 2025, the stock ground down to a $9.30 52-week low and its Mansfield relative strength stayed deeply negative versus the Nasdaq Composite for roughly a year. That changed in June–July 2026 — a steep six-week advance from the $9.98 June 3 low to $13.81 on July 14 pushed relative strength back above zero for the first time in this window. The setup now is a pullback inside a young uptrend: the July 17 session dropped the stock to $12.90 on twice-average volume, printing a MACD dead cross on the same day an already-flagged bearish RSI divergence resolved lower. The next few sessions around the $12.34–$12.94 shelf will show whether this is a constructive reset or the start of a deeper retracement.
Snapshot all values from the July 17, 2026 chart data
| Item | Value | Read |
|---|---|---|
| Close | $12.90 | −10.3% from 52w high, +38.7% from 52w low |
| 52-week range | $9.30 – $14.38 | Upper half of the range after the June–July run |
| SMA 5 / 20 / 60 | $13.51 / $12.94 / $11.60 | Below SMA5, a hair under SMA20, well above rising SMA60 |
| Bollinger (20, 2σ) | $14.27 / $12.94 / $11.61 · width 20.59% | Pulled back from the upper band to the midline |
| Anchored VWAP (90d) | $12.33 (anchor Jun 4, 2026) | Price above — recent buyers still in profit on average |
| Anchored VWAP (2y) | $11.21 (anchor Feb 10, 2026) | Price above the long-frame anchor as well |
| RSI(14) | 54.2 | Bearish divergence: Jun 26 ($12.34, RSI 82.1) vs Jul 14 ($13.81, RSI 78.4) |
| MACD (12,26,9) | 0.549 vs signal 0.592 · hist −0.044 | Dead cross on Jul 17, 2026 — fresh, still high above zero |
| Mansfield RS (vs Nasdaq Composite) | +1.92% · outperform · rising | Prev week +4.75 / prev month −10.79 (see §5) |
| ADX(14) | 36.5 | Strong trend — strength was built on the advance |
| ATR(14) | $0.45 (3.51% of price) | Moderate volatility for position sizing |
| OBV | 2y: early distribution (below MA20, flat) · 90d: improving (below MA20, rising) | Frames disagree — see §7 |
| Volume | 1,246,300 vs 20-day avg 610,475 (2.04×) | Heavy volume on a down day |
| ATR stops | 1× $12.45 · 2× $11.99 | Objective invalidation references from the close |
① Price & Moving Averages
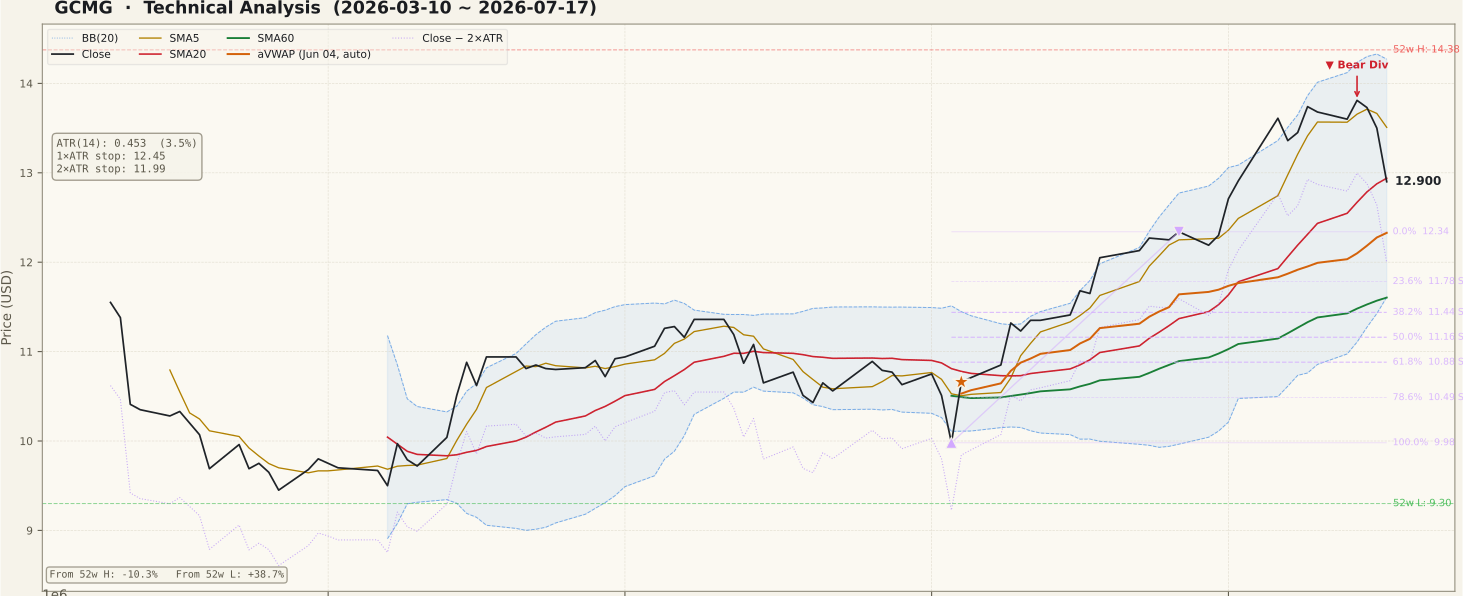
The 90-day frame shows a textbook base-to-breakout sequence: a flat spring base near $9.50–$10.00, a June 3 pivot low at $9.98, then a persistent advance that rode the upper Bollinger band into the $13.81 July 14 high. The July 17 candle broke that rhythm — price fell back below the 5-day average ($13.51) and closed at $12.90, fractionally under the 20-day average and Bollinger midline at $12.94. Structure is still constructive above the rising SMA60 ($11.60) and both anchored VWAPs ($12.33 on the 90-day anchor, $11.21 on the two-year anchor), which means the average buyer since early June remains in profit and has less pressure to sell. The Fibonacci grid on the June up-swing ($9.98 → $12.34) puts the 0% anchor at $12.34 — the June 26 high the stock broke through in July — directly below the close, making $12.34–$12.94 the shelf that decides this pullback. There are no unfilled gaps on either timeframe to act as magnets.
② Volume

Friday's decline printed 1,246,300 shares against a 20-day average of 610,475 — a 2.04× ratio, and the session was red. Heavy volume on a down day after a six-week advance is the signature of profit-taking, and it deserves respect rather than rationalization. That said, the advance itself also carried volume spikes on up days (late June and mid-July), so participation during the run was real, not hollow. Average daily dollar volume in the mid-single-digit millions means liquidity is adequate but not deep; on fast days the spread can add slippage, which argues for limit orders rather than market orders in this name. Watch whether follow-on down days keep this volume signature — one heavy red bar is a warning, a cluster of them is distribution.
③ MACD

MACD printed a dead cross on July 17 — the same day as the heavy-volume decline — with the MACD line at 0.549 slipping under the signal at 0.592 and the histogram turning negative at −0.044. Two things temper the bearish read. First, the cross happened far above the zero line, which is where momentum cooldowns inside intact uptrends typically occur; a cross below zero would be a materially worse signal. Second, the histogram deficit is still shallow, so a quick price stabilization could recross it without much damage. The bearish qualifier is context: this cross lands on top of an RSI divergence and a 2×-volume red candle, and clustered signals carry more weight than any one alone. Treat a deepening histogram over the next few sessions as confirmation that the pullback has legs.
④ RSI

RSI(14) sits at 54.2 after a sharp unwind from overbought territory, and the data flags a completed bearish divergence: on June 26 price closed at $12.34 with RSI at 82.1, while the higher price high of $13.81 on July 14 came with a lower RSI peak of 78.4. Higher price, weaker momentum — that is the classic warning that the last leg up was running on thinner fuel, and Friday's drop is the divergence resolving. A common beginner mistake is to treat a divergence as a standalone sell-everything signal; statistically it flags elevated reversal risk, not a certain top, and it required exactly the kind of confirmation (a heavy red candle, a MACD cross) that has now arrived. From here the mid-50s reading is neutral: holding the 50 zone would keep the uptrend's momentum profile intact, while a decisive break below 50 would tilt the odds toward the deeper-retracement scenario.
⑤ Mansfield Relative Strength vs the Nasdaq Composite

Mansfield RS stands at +1.92% versus the Nasdaq Composite — above the zero line, tagged outperform with a rising slope. The monthly arc is the headline: a month ago this reading was −10.79, so the stock has gained roughly 12.7 points of relative ground in four weeks, one of the sharpest improvements a chart can show, and on the two-year frame it ends about a year of continuous underperformance. The weekly detail is less flattering: a week ago RS printed +4.75, so the most recent week gave back about 2.8 points — the stock is still outperforming, but the outperformance is slowing, consistent with Friday's pullback. Fresh zero-line crossings are inherently fragile; the constructive path is RS consolidating above zero while price digests gains, and the warning path is a quick slip back below zero, which would mark the July strength as a one-off spike rather than a regime change.
⑥ ATR & ADX volatility and trend strength

ADX(14) reads 36.5 — comfortably in strong-trend territory — and, importantly, that strength was accumulated during the June–July advance, so for now the strong trend the ADX measures is the uptrend. Remember that ADX measures intensity, not direction: if the pullback deepens and persists, a high ADX would begin describing the decline instead. ATR(14) at $0.45, or 3.51% of price, has ticked up with the late-stage volatility and is the sizing input for this setup: the 1×ATR reference sits at $12.45 and the 2×ATR stop at $11.99, about 7.0% below the close. A stop that wide means position size, not conviction, is how risk gets controlled here — sizing the position so a full 2×ATR loss is tolerable is the discipline this volatility profile demands.
⑦ OBV on-balance volume

The two timeframes disagree, and both deserve to be on the record. The 90-day frame reads improving: OBV is still below its 20-day average (divergence −81.06%) but the slope is rising — volume flow turned constructive during the June–July advance and is climbing out of its hole. The two-year frame reads early distribution: OBV at −9,241,100 sits below its long-frame MA20 (−7,670,315, divergence −20.48%) with a flat slope, meaning the multi-quarter selling that accompanied 2025's decline has not yet been repaired. The honest synthesis: short-term money has been coming in, but the long frame has not confirmed accumulation, and Friday's 2×-volume red bar subtracted from the short-term repair. If the 90-day OBV can reclaim its MA20 while price holds the $12.34 shelf, the accumulation case strengthens materially; if OBV rolls over here, the rally loses its volume sponsorship.
Bull Case vs Bear Case
Bull Case
- Mansfield RS crossed above zero (+1.92%) vs the Nasdaq Composite — first outperformance after about a year below the line, slope still rising.
- Monthly RS swing of roughly +12.7 points (−10.79 → +1.92) — a sharp, broad relative-strength repair.
- Price holds above the rising SMA60 ($11.60) and both anchored VWAPs ($12.33 / $11.21) — average buyers remain in profit.
- ADX 36.5: trend strength was built on the advance, and strong trends usually absorb a first pullback.
- 90-day OBV improving (rising slope) — volume flow turned constructive during the run.
- The MACD dead cross printed far above the zero line — the profile of a momentum cooldown, not (yet) a trend failure.
Bear Case
- Confirmed bearish RSI divergence: Jun 26 $12.34/RSI 82.1 vs Jul 14 $13.81/RSI 78.4 — higher price, weaker momentum.
- MACD dead cross on July 17 with the histogram flipping negative, clustering with the divergence.
- The decline came on 2.04× average volume — heavy-volume selling after a six-week advance.
- Two-year OBV still reads early distribution (below MA20, flat) — the long frame never confirmed accumulation.
- Weekly RS change is negative (+4.75 → +1.92) — outperformance already slowing days after the zero cross.
- Price lost the SMA5 ($13.51) and closed a hair under the SMA20/Bollinger midline, with the 52-week high still 10.3% overhead.
Scenarios
| Scenario | Probability | Path | Trigger / Invalidation |
|---|---|---|---|
| Constructive pullback holds | ~45% | Price stabilizes on the $12.34–$12.94 shelf (June 26 high / 0% swing anchor, SMA20, 90d aVWAP), volume on down days dries up, then a retest of $13.81 and the $14.27–$14.38 band. | Trigger: reclaim of the SMA5 on above-average up-day volume. Invalidated by a close below $12.34. |
| Deeper retracement | ~35% | The shelf gives way; price works down through the 23.6% retracement at $11.78 toward the lower Bollinger band / SMA60 / 38.2% zone around $11.44–$11.61, where the larger uptrend gets its real test. | Trigger: a daily close below $12.34, especially on above-average volume. The 2×ATR stop at $11.99 is hit inside this path. |
| Divergence marks the top | ~20% | Weak bounces fail below $13.81, RS slips back under zero, and price breaks the $11.44–$11.61 support cluster, unwinding toward the 50–61.8% retracements at $11.16 / $10.88. | Trigger: close below $11.99 (2×ATR stop) plus Mansfield RS back below zero. Invalidated by a close above $13.81. |
Key Levels
| Price | Role | Basis |
|---|---|---|
| $14.38 | Resistance | 52-week high (early 2025 peak zone) |
| $13.81 | Resistance | July 14, 2026 swing high — the bearish-divergence peak |
| $13.51 | Resistance | SMA5 — first reclaim target for the bulls |
| $12.94 | Resistance | SMA20 / Bollinger midline, a hair above the close |
| $12.90 | Current | Close, July 17, 2026 |
| $12.34 | Support zone | June 26 high — 0% anchor of the June up-swing; 90d aVWAP $12.33 sits in the same zone |
| $11.99 | Stop-loss | 2×ATR stop (−7.0% from the close) — objective invalidation |
What to Watch
- The $12.34 shelf on a closing basis — the June 26 breakout high, the swing's 0% anchor and the 90-day aVWAP all cluster here; holding it keeps the pullback constructive, losing it opens $11.78 and below.
- RSI at the 50 line — stabilizing in the low-to-mid 50s keeps the momentum profile bullish after the divergence unwind; a decisive break below 50 tilts toward the deeper scenarios.
- Volume signature of the next red days — another 2×-average down day would upgrade Friday's warning into a distribution pattern; shrinking down-day volume is what healthy digestion looks like.
- Mansfield RS vs the zero line — the freshly earned outperformance is fragile and already slowing week-over-week; a slip back below zero would undercut the core bull argument.
- MACD histogram depth — a shallow, quickly recovered dead cross is routine inside uptrends; a deepening negative histogram confirms the pullback has momentum behind it.
Conclusion
Past Analyses of This Stock same ticker · newest first
This analysis is an educational interpretation of chart data and is not investment advice. Probabilities and levels are subjective estimates; every investment decision, and its outcome, is your own responsibility. Indicator values are taken from closing data as of July 17, 2026 and will change as new sessions print. If a large price move coincides with a news catalyst (earnings, guidance, corporate actions), do not act on technicals alone — check the fundamental catalyst first.
Two Week Swing · twoweekswing.com · 4,600+ stocks screened weekly