Flotek Industries, Inc.
$25.56 −0.4% from 52-week high · +133.4% above 52-week low
This analysis is based on closing-price data as of July 10, 2026. Whether you're researching how to buy Flotek Industries, Inc. stock or you've just opened a brokerage account and are trying to time an entry, here are objective support levels and stop-loss references built from the RSI, MACD and ATR indicators.
FTK is one of the strongest two-year charts on the NYSE: a stair-stepping advance from under $5 to $25.56, up 133.4% from its 52-week low and closing within 0.4% of the $25.65 fifty-two-week high. Relative strength versus the S&P 500 is an emphatic +41.28% and still accelerating. The near-term question is whether this week's push into the old high is the start of a fresh breakout leg or a double-top test: volume on the approach was merely average (1.04x), the RSI printed a bearish divergence against the June peak, and ADX says the newest up-leg is still young. Strong stock, demanding entry point.
Snapshot all values from chart JSON, July 10, 2026
| Item | Value | Reading |
|---|---|---|
| Close | $25.56 | −0.4% from 52w high, +133.4% above 52w low |
| 52-week high / low | $25.65 / $10.95 | pressing the top of the yearly range |
| SMA 5 / 20 / 60 | $23.84 / $23.30 / $20.40 | bullish stack, close above all three |
| Bollinger (upper / mid / lower) | $25.42 / $23.30 / $21.18 | close just above the upper band (width 18.21%) |
| aVWAP 90d (anchor Jun 2, 2026) | $23.32 | recent swing buyers in profit |
| aVWAP 2y (anchor May 7, 2025) | $15.74 | long-term holders deeply in profit — little forced-selling pressure |
| RSI(14) | 63.09 | neutral-strong, but a bearish divergence vs the June 12 peak |
| Mansfield RS vs the S&P 500 | +41.28% | strong outperformer, accelerating (prev week +25.01, prev month +39.33) |
| MACD (12,26,9) | 0.71 / 0.64 / +0.07 | golden cross printed July 10 |
| ADX(14) | 20.34 (90d) / 20.00 (2y) | trend strength only emerging after the June consolidation |
| ATR(14) | $1.52 (5.95%) | high daily volatility — small-cap swings |
| OBV | 2y: early accumulation (flat) / 90d: accumulation (rising) | above MA20 on both frames |
| Volume vs 20-day avg | 1.04x | average volume at a 52-week high — breakout not yet confirmed |
| ATR stops (1x / 2x) | $24.04 / $22.52 | objective invalidation references |
① Price & Moving Averages
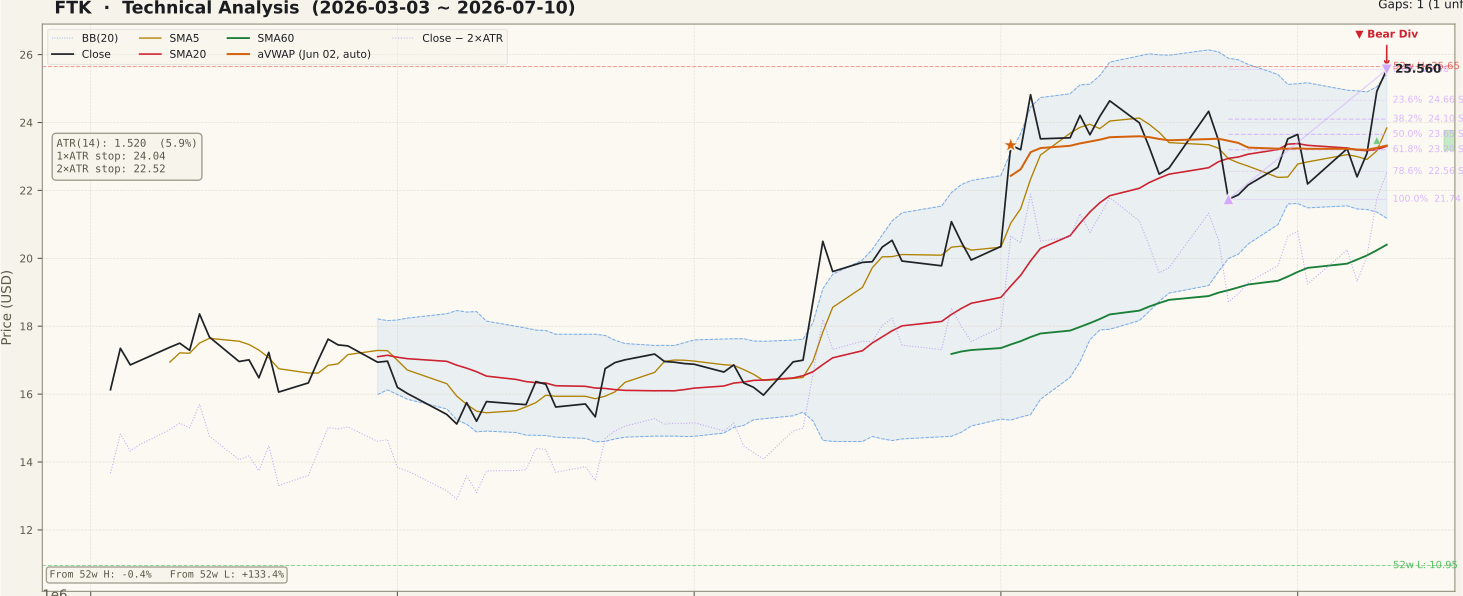
The 90-day chart shows the May breakout from the $16–$17 shelf, a June consolidation between roughly $22 and $25, and this week's thrust to $25.56 — right at the upper Bollinger Band ($25.42) and within cents of the $25.65 fifty-two-week high. The moving averages are stacked bullishly (SMA5 $23.84 > SMA20 $23.30 > SMA60 $20.40) with the close above all three. The Fibonacci grid on the June 24 to July 10 swing ($21.74 to $25.56) places first support at $24.66 (23.6%) and $24.10 (38.2%), and an unfilled July 9 gap at $23.18–$23.77 sits just below, reinforced by the 90-day anchored VWAP at $23.32. On the two-year frame the advance is a textbook stage-two staircase — higher bases since mid-2024 — which is why this test of the high matters: above $25.65 there is no chart history at all.
② Volume

Here is the weak link. The push to the doorstep of a 52-week high came on 292,922 shares — just 1.04x the 20-day average of 282,686. Breakouts that stick are typically driven by a clear volume expansion; an approach on average volume says demand is steady but not urgent. This is the classic unconfirmed-breakout trap that catches beginners: buying the touch of the high before volume proves the move. Dollar liquidity (roughly $7–8 million traded on the day) is adequate for a small cap but thin enough that slippage matters — limit orders over market orders here. Watch for a 1.5x-plus volume day through $25.65 as the confirmation signal.
③ MACD

MACD (0.71) recrossed above its signal line (0.64) on July 10 after drifting lower through late June — a fresh golden cross above the zero line, consistent with the uptrend reasserting itself after a month of digestion. The histogram just flipped positive at +0.07, so the cross is brand new and shallow; one strong red day could undo it. Read this as momentum turning back up from a reset rather than a mature thrust — encouraging, but it needs follow-through to mean anything, ideally alongside the volume confirmation the breakout still lacks.
④ RSI

RSI(14) sits at 63.09 — firm but not overbought — yet the data flags a bearish divergence: on June 12 price hit $24.64 with RSI at 69.92, while the July 10 close at $25.56, nearly a dollar higher, produced a lower RSI of 63.09. Each incremental price high is being earned with less momentum. Two things keep this in perspective: the divergence formed across a sideways June consolidation, which naturally cools RSI, and a divergence is a warning of possible reversal, not a confirmed one — it would take a rejection at the high and a break of the $24.66–$24.10 support band to validate it. Until then it argues for discipline about entry price, not for avoiding the stock.
⑤ Mansfield Relative Strength

Mansfield RS vs the S&P 500 reads +41.28% — FTK has trounced the index over the measured window, and the reading has spent essentially the entire 90-day chart above the zero line. The trajectory is still improving: +25.01 a week ago (a +16.26-point acceleration) and +39.33 a month ago (+1.94 points). In relative-strength terms this is exactly the profile swing traders screen for — a confirmed leader getting stronger, not a laggard bouncing. The caveat with readings this stretched is that they often mark crowd enthusiasm; relative strength tells you the horse is fast, not that the current price is a good place to mount.
⑥ ATR & ADX

ADX at 20.34 on the 90-day frame reads "emerging" — directional strength is only beginning to rebuild after the June consolidation ground it down (the two-year frame still labels the regime "ranging" at 20.00). A rising ADX from ~20 alongside a breakout would be the constructive sequence; a stalled ADX would say the range is not finished. ATR at $1.52 is 5.95% of price, so this stock routinely moves in a day what an index moves in a month — the 1x ATR reference sits at $24.04 and the 2x ATR stop at $22.52, roughly 11.9% below the close. Size positions off that distance; tightening the stop into the noise band is how small-cap swings shake traders out at the worst moment.
⑦ OBV (On-Balance Volume)

OBV is constructive on both frames, with a nuance worth noting. The 90-day OBV (3,322,922) is in full accumulation — above its 20-day average (2,144,651) by 54.94% and rising, and it pushed to new highs with this week's advance, which partially offsets the average-volume concern from the volume panel. The two-year frame is tagged early accumulation: above its average but with a flat slope (a 9.82% divergence gap), meaning the long-horizon money flow is positive but not yet emphatic. Both frames above their averages is the right configuration for a breakout attempt; what you don't want to see is the 90-day OBV rolling below its average while price hovers at the high.
Bull Case vs Bear Case
Bull Case
- Mansfield RS +41.28% vs the S&P 500 and still accelerating (+16.26 pts in a week)
- Within 0.4% of the 52-week high — no overhead supply above $25.65
- Two-year staircase of higher bases; bullish SMA stack with a rising SMA60
- Fresh MACD golden cross on July 10 after a month-long momentum reset
- 90-day OBV at new highs, +54.94% above its average — accumulation intact
- Two-year anchored VWAP at $15.74 — holders sit on large gains, little trapped supply
Bear Case
- Breakout attempt on 1.04x average volume — demand not yet proven at the high
- Bearish RSI divergence: $24.64 / RSI 69.92 (Jun 12) vs $25.56 / RSI 63.09 (Jul 10)
- Double-top risk at $25.65 until price closes decisively above it
- ADX ~20 — trend strength still emerging; the June range may not be finished
- ATR 5.95% of price and modest dollar liquidity — slippage and whipsaw risk
- +133.4% above the 52-week low — extended, vulnerable to profit-taking
Scenarios
| Scenario | Probability | Path | Trigger / Invalidation |
|---|---|---|---|
| Consolidate below the high | ~40% | Backs off the $25.65 barrier into the $24.66–$24.10 band, resets the RSI divergence, and builds a tighter shelf before the next attempt. | Trigger: rejection at the high on light volume. Constructive while closes hold above the $23.18 gap bottom. |
| 52-week-high breakout | ~35% | Clears $25.65 into open air — no overhead chart history — and begins price discovery with the RS leadership profile behind it. | Trigger: daily close above $25.65 on 1.5x-plus average volume. Invalidated by a quick close back below $24.66. |
| Double-top rejection | ~25% | The divergence asserts itself: failure at $25.65, loss of the $24 band, gap fill to $23.18 and a slide toward the SMA20 zone. | Trigger: daily close below the $23.18 gap bottom; a close below the 2x ATR stop at $22.52 negates the swing setup. |
Key Levels
| Price | Role | Basis |
|---|---|---|
| $25.65 | Resistance | 52-week high — the breakout line |
| $25.56 | Current | Close, July 10, 2026 (swing high / Fibonacci 0%) |
| $25.42 | Support | Bollinger upper band, first reference under the close |
| $24.66 | Support | Fibonacci 23.6% retracement of the June–July swing |
| $24.10 | Support | Fibonacci 38.2% retracement (near the 1x ATR reference $24.04) |
| $23.77–$23.18 | Support | Unfilled July 9 gap + 90d anchored VWAP $23.32 + Fib 61.8% $23.20 |
| $22.52 | Stop-loss | 2x ATR below close — objective invalidation |
What to Watch
- A daily close above $25.65 and, critically, the volume on that day — 1.5x average or better validates the breakout; average volume leaves it suspect.
- RSI on the next high: a push above 69.92 cancels the bearish divergence; another lower high while price grinds up deepens it.
- ADX direction from ~20 — rising confirms a new trend leg; flat says the June range is still in charge.
- The $23.77–$23.18 gap-plus-aVWAP shelf on any pullback: that is the structural line for the bull case ahead of the stop.
- A close below $22.52 (2x ATR stop) — mechanical exit for the swing setup.
Conclusion
Past Analyses of This Stock same ticker · newest first
This analysis is an educational interpretation of chart data and is not investment advice. Probabilities and levels are subjective estimates; every investment decision, and its outcome, is your own responsibility. A bottoming signal is not a buy signal, and an unconfirmed breakout is not a breakout. All figures are derived from closing-price data as of July 10, 2026 and may be outdated by the time you read this.
Two Week Swing · twoweekswing.com · 4,600+ stocks screened weekly