First Financial Bancorp.
$35.72 −1.5% from 52-week high
This analysis is based on closing-price data as of July 17, 2026. Whether you're researching how to buy First Financial Bancorp. stock or you've just opened a brokerage account and are trying to time an entry, here are objective support levels and stop-loss references built from the RSI, MACD and ATR indicators.
On the two-year chart FFBC has completed a long round trip: a slide through most of 2025, a base near the $23–$24 area, and since February 2026 a stair-step advance that now sits $35.72 — just 1.5% below the 52-week high of $36.25. The moving averages are in full bullish alignment, relative strength vs the Nasdaq Composite is at +18.9% and still accelerating, and a fresh MACD golden cross printed on July 16. The counterweight is a textbook bearish RSI divergence into the highs with OBV still below its 20-day average — so the lens here is a strong trend that has earned respect, priced at a spot where chasing carries a thin margin for error.
Snapshot all values from the July 17, 2026 chart data
| Item | Value | Read |
|---|---|---|
| Close | $35.72 | −1.5% from 52w high, +54.9% off 52w low |
| 52-week high / low | $36.25 / $23.06 | High set July 16–17 zone; low far below |
| SMA 5 / 20 / 60 | $35.07 / $33.96 / $31.70 | Full bullish alignment, all rising |
| Bollinger (upper / mid / lower) | $36.21 / $33.96 / $31.70 | Price pressing the upper band; width 13.27% |
| aVWAP — 2y anchor (Nov 6, 2024) | $27.70 | Long-term holders well in profit |
| aVWAP — 90d anchor (Apr 17, 2026) | $31.86 | Recent buyers also in profit |
| RSI(14) | 68.2 | Near overbought; bearish divergence flagged |
| MACD (12,26,9) | 0.98 vs signal 0.90 | Golden cross July 16; histogram +0.09 |
| Mansfield RS (vs Nasdaq Composite) | +18.9% | Outperforming; +7.2 pts w/w, +15.6 pts m/m |
| ADX(14) | 38.9 (90d) / 38.2 (2y) | Strong trend regime |
| ATR(14) | $0.75 (2.1% of price) | Moderate daily range |
| OBV (2y / 90d) | −6.05% / −2.04% vs MA20 | Improving, rising, but still below MA20 on both frames |
| Volume (last session) | 3,379,500 (2.65× 20-day avg) | Heavy turnover near the highs |
| ATR stops (1× / 2×) | $34.97 / $34.22 | 2×ATR stop = −4.2% from close |
① Price & Moving Averages
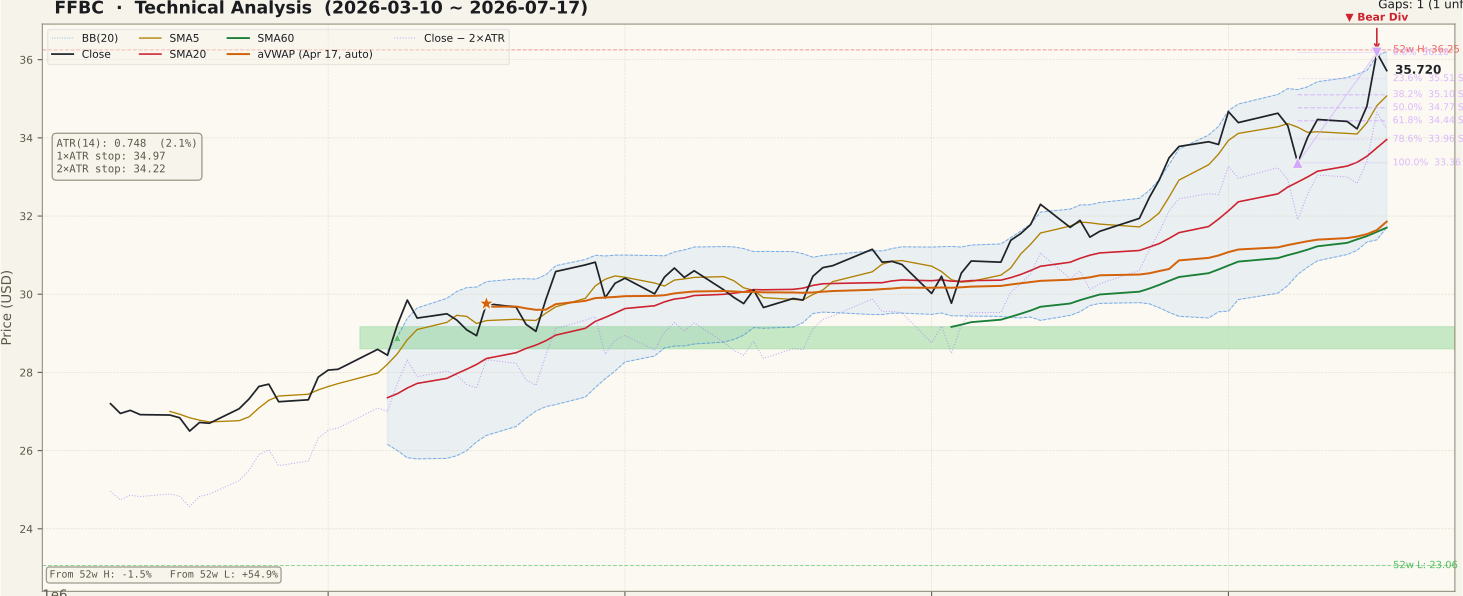
The 90-day window shows a disciplined stair-step: higher lows through April and May along a rising 20-day average, then a steeper leg from late June that has carried price along the upper Bollinger band. The close of $35.72 sits above SMA5 ($35.07), SMA20 ($33.96) and SMA60 ($31.70) — a full bullish stack with all three rising, which is the structural definition of an intact uptrend. Both anchored VWAPs agree: the two-year anchor from November 6, 2024 sits at $27.70 and the April 17, 2026 anchor at $31.86, so the average buyer on both horizons is in profit and there is little trapped overhead supply below. The friction is location: price is pressing the upper band at $36.21 with the 52-week high at $36.25 directly overhead, and the July swing's 23.6% retracement at $35.51 is the first support underneath. An unfilled gap from April 8 ($28.60–$29.17) remains far below as a long-term support marker, not a near-term factor.
② Volume

The last session traded 3,379,500 shares, 2.65× the 20-day average of 1,272,790 — the third volume spike since late June, and this one landed within 1.5% of the 52-week high. Heavy turnover near highs cuts both ways: it can be institutional accumulation powering a breakout, or early distribution as longer-term holders sell into strength. Mid-July is also the heart of bank earnings season, so a burst like this deserves a check of the news calendar before it is read as a purely technical signal. What tips the balance is follow-through: if the next push above $36.25 arrives on comparable volume, the expansion reads as confirmation; if price stalls here while volume stays elevated, the distribution reading gains weight.
③ MACD

MACD printed a fresh golden cross on July 16, with the line at 0.98 back above the signal at 0.90 and the histogram positive at +0.09. The context matters: this cross occurred high above the zero line, after only a shallow dip — that is the signature of a trend refusing to give back ground rather than a fresh cycle starting from washed-out levels. Crosses this far above zero are continuation signals with less runway than early-cycle crosses, and the histogram's modest size says momentum re-expansion is real but not explosive yet. A rollover back below the signal line within a few sessions would mark the cross as a fake-out and strengthen the pullback case.
④ RSI

RSI(14) reads 68.2 — just under the overbought line, and the chart flags a regular bearish divergence with specific coordinates: on July 1 price hit $34.67 with RSI at 77.03, and on July 16 price made a higher high at $36.18 while RSI printed a lower high of 73.41. Price advanced roughly $1.50 while momentum faded four points — the classic sign that the latest leg is running on less thrust. A common beginner mistake is treating this as an automatic sell signal: in strong trends, bearish divergences frequently resolve through time (a sideways pause) rather than price (a correction), and RSI holding the 50–60 zone on any dip would keep the trend structure intact. The divergence is a possibility of a pause, not a confirmed top — it needs a price trigger, such as a loss of $35.51, before it carries real weight.
⑤ Mansfield Relative Strength

Mansfield RS vs the Nasdaq Composite stands at +18.9% with a rising slope — unusual leadership for a regional bank measured against a tech-heavy benchmark. The trajectory is the striking part: a week ago the reading was +11.6 and a month ago +3.3, so relative strength has gained +7.2 points on the week and +15.6 points on the month — positive and accelerating on both horizons. On the two-year panel, RS spent most of mid-2025 deeply negative and only decisively crossed above zero in early 2026, meaning the current leadership phase is measured in months, not weeks — young enough to have room, established enough to be trusted. For swing setups this is the strongest single input on the chart: money is actively rotating toward this name faster than toward the index.
⑥ ATR & ADX

ADX at 38.9 (38.2 on the two-year frame) is firmly in strong-trend territory — well above the 25 threshold — and here it is measuring the strength of an advance, since the directional move is up. Remember ADX gauges intensity, not direction; the takeaway is that this is a trending tape where trend-following tactics have the edge and counter-trend fades are fighting the current. ATR(14) at $0.75 (2.1% of price) keeps risk math manageable: the 1×ATR stop sits at $34.97 and the 2×ATR stop at $34.22, about 4.2% below the close. Position size should be set from that dollar distance rather than from conviction — a strong ADX does not exempt a trade from a pre-defined exit.
⑦ OBV

OBV tells the same nuanced story on both timeframes: rising slope, improving state, yet still below its 20-day average — by −2.04% on the 90-day frame and −6.05% on the two-year frame. In plain terms, cumulative volume flow is recovering and pointed the right way, but it has not yet fully confirmed the price advance to new highs. This is a milder cousin of the RSI divergence: price is at its best levels of the year while the volume ledger lags slightly behind. It is not a distribution signal — the slope is up on both frames — but until OBV reclaims its 20-day average, the breakout attempt lacks its cleanest volume endorsement. Watch for that reclaim as a quiet confirmation that heavy recent turnover is accumulation.
Bull Case vs Bear Case
Bull Case
- Full bullish MA alignment — close > SMA5 > SMA20 > SMA60, all rising.
- Mansfield RS +18.9% vs the Nasdaq Composite, accelerating both weekly (+7.2 pts) and monthly (+15.6 pts).
- Fresh MACD golden cross (July 16) with a positive histogram — momentum re-expanding.
- ADX 38.9 confirms a strong, established trend regime.
- Price above both anchored VWAPs ($27.70 two-year, $31.86 90-day) — minimal trapped supply overhead.
- 52-week high only 1.5% away; last session's 2.65× volume shows active participation.
Bear Case
- Confirmed bearish RSI divergence: price higher high July 16 ($36.18) on a lower RSI high (73.41 vs 77.03 on July 1).
- RSI 68.2 sits at the edge of overbought — limited momentum headroom.
- OBV below its 20-day average on both frames — volume flow has not confirmed the new highs.
- Price pressing the upper Bollinger band ($36.21) with the 52-week high ($36.25) capping directly above.
- Heavy 2.65× volume near highs is ambiguous — it can mark distribution as easily as accumulation.
- Reward-to-risk at the current price is thin: ~1.5% to resistance vs ~4.2% down to the 2×ATR stop.
Scenarios
| Scenario | Probability | Path | Trigger / Invalidation |
|---|---|---|---|
| Breakout continuation | ~45% | Clears the 52-week high and begins a band-walk along the upper Bollinger band into price discovery. | Trigger: daily close above $36.25 on at least average-plus volume. Invalidated if the breakout is rejected and price closes back below $35.51. |
| Divergence pullback, trend intact | ~35% | RSI divergence resolves through a controlled dip into the $35.10–$34.44 Fibonacci cluster (38.2–61.8% of the July swing), near the rising SMA20, then the trend resumes. | Trigger: rejection at $36.18–$36.25 plus a close below $35.51. Invalidated by a high-volume breakout first. |
| Deeper correction | ~20% | Selling accelerates through the ATR stop; price tests the 78.6% retracement at $33.96 and the July 8 swing low at $33.36. | Trigger: daily close below the 2×ATR stop at $34.22. The bullish setup is void below $33.36. |
Key Levels
| Price | Role | Basis |
|---|---|---|
| $36.25 | Resistance | 52-week high |
| $36.21 | Resistance | Upper Bollinger band |
| $36.18 | Resistance | July 16 swing high — 0% of the July swing |
| $35.72 | Current | July 17 close |
| $35.51 | Support | 23.6% retracement of the July swing (from the $33.36 low to the $36.18 high) |
| $34.77 | Support | 50% retracement of the July swing |
| $34.22 | Stop-loss | 2×ATR stop (−4.2% from close) |
What to Watch
- A daily close above $36.25 on strong volume — the cleanest continuation trigger; a low-volume poke above the high is suspect.
- How the RSI divergence resolves — RSI pushing back above 73.4 (the July 16 peak) would neutralize it; a close below $35.51 would activate the pullback path toward $35.10–$34.44.
- OBV reclaiming its 20-day average on the 90-day frame — the missing volume confirmation for the advance.
- Relative strength vs the Nasdaq Composite — a stall or rollover from +18.9% would signal the leadership phase cooling before price shows it.
- The news calendar — mid-July is bank earnings season and the last session ran 2.65× average volume; identify the catalyst behind heavy turnover before leaning on technicals alone.
Conclusion
Past Analyses of This Stock same ticker · newest first
This analysis is an educational interpretation of chart data and is not investment advice. Probabilities and levels are subjective estimates; every investment decision, and its outcome, is your own responsibility. Technical signals alone are not a sufficient basis to buy or sell any stock, particularly around earnings and other fundamental catalysts.
Two Week Swing · twoweekswing.com · 4,600+ stocks screened weekly