Everpure Inc
$79.33 −21.1% from 52-week high
This analysis is based on closing-price data as of July 10, 2026. Whether you're researching how to buy Everpure Inc stock or you've just opened a brokerage account and are trying to time an entry, here are objective support levels and stop-loss references built from the RSI, MACD and ATR indicators.
Everpure is a high-volatility swing stock knocking on its July ceiling. Two years of wide travel — a late-2025 run to $100.59, a sharp December break, then months of $60–$87 swings — have brought price to $79.33, about a dollar and a half below the $80.96 July 9 swing high and +48.5% above the 52-week low. A June 30 MACD golden cross with a wide histogram and a +11.6-point month of Mansfield RS repair put momentum on the buyers’ side; volume at roughly half its average, a 5.7% daily ATR and a still-negative RS line say the breakout is not yet earned. The lens: does $80.96 break on real volume, or does price return to the $74.75–$75.50 confluence to rebuild?
Snapshot all values from the July 10, 2026 chart data
| Item | Value | Read |
|---|---|---|
| Close | $79.33 | −21.1% from 52w high / +48.5% from 52w low |
| 52-week high / low | $100.59 / $53.43 | very wide 52-week range — a fast, high-beta chart |
| SMA 5 / 20 / 60 | $78.80 / $74.75 / $75.50 | close above all three; SMA20 still below SMA60 — repair incomplete |
| Bollinger (20, 2) | $81.53 / $74.75 / $67.96 | width 18.16%; price pressing the upper half of the band |
| aVWAP 90d | $74.90 (anchor May 28, 2026) | price above — recent buyers in profit |
| aVWAP 2y | $71.45 (anchor Dec 3, 2025) | price above — post-break buyers in profit |
| RSI (14) | 54.9 | neutral-positive; no RSI divergence flagged |
| MACD (12, 26, 9) | 0.94 / signal 0.13 / hist +0.81 | golden cross June 30, 2026; histogram wide and positive |
| Mansfield RS (vs the S&P 500) | −2.1% | +11.6 pts vs a month ago, +6.8 pts vs last week — closing on zero |
| ADX (14) | 14.3 | ranging / weak trend strength despite the bounce |
| ATR (14) | $4.54 (5.72%) | high volatility — wide stops, smaller size |
| OBV 2y / 90d | Early accumulation / Early accumulation | above MA20, flat slope on both timeframes |
| Volume vs 20d avg | 0.55× | quiet tape — the push toward the high lacks turnover so far |
| 1× / 2× ATR stop | $74.79 / $70.26 | 2× ATR stop is −11.4% below the close |
① Price & Moving Averages
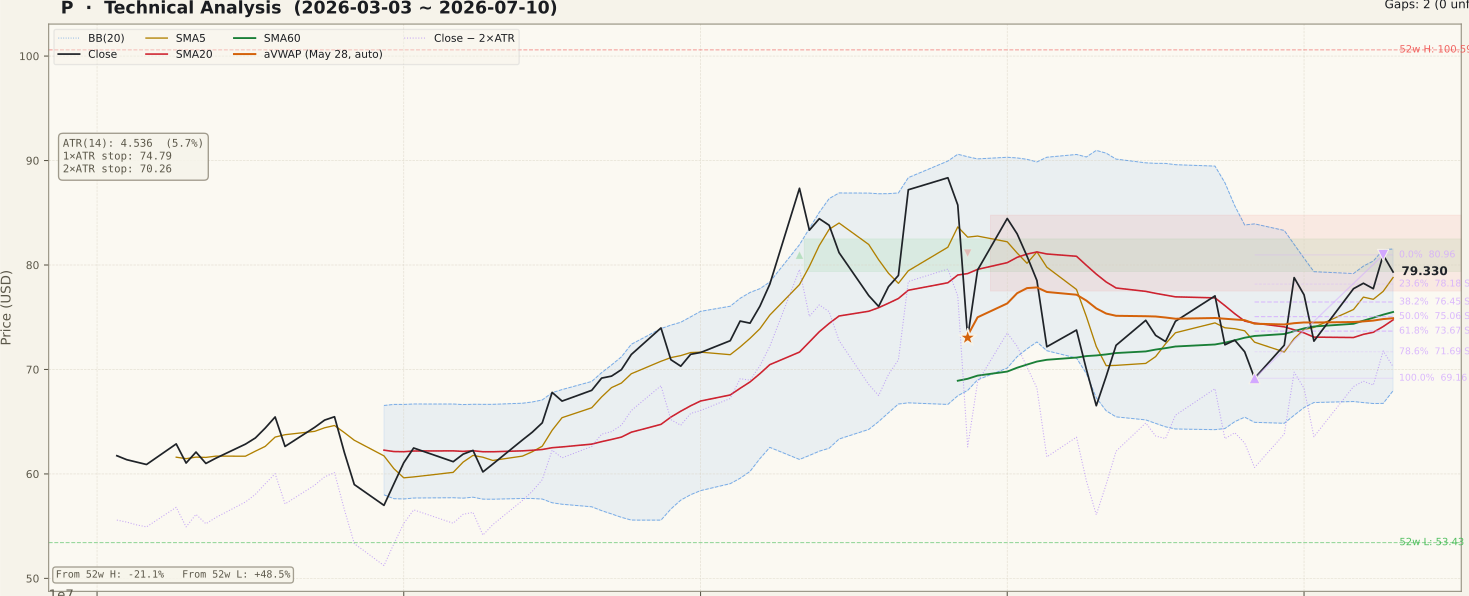
The two-year picture is a rollercoaster: a September–November 2025 vertical run to the $100.59 52-week high, a violent December break, and 2026 spent swinging between roughly $60 and $87. Inside the 90-day window the tone is constructive — a June 26 higher low at $69.16, a push to $80.96 on July 9, and a close at $79.33 above SMA5 ($78.80), SMA20 ($74.75) and SMA60 ($75.50). Note one structural blemish: the 20-day average is still below the 60-day, so the intermediate trend has not fully flipped. Against the June 26 → July 9 swing, the shallow 23.6% retracement sits at $78.18 — the first support under price — while the 50% level at $75.06 lands inside a dense cluster with the SMA60, SMA20 / Bollinger mid and the 90-day anchored VWAP ($74.90): the key demand zone if the ceiling holds. Above, the 2-year swing high from May 11 at $87.34 is the next meaningful objective after $80.96.
② Volume

The last session traded 1,681,111 shares against a 20-day average of 3,075,136 — 0.55× normal. That is the central tension in this chart: price is a good day away from a swing-high breakout, but the approach is happening on roughly half-average turnover. Breakouts attempted on thin volume at a well-watched level like $80.96 are exactly where newer traders get trapped — the move needs expansion through and after the level, not just a print above it. The flip side: light volume on up days near the high at least shows no urgent distribution. Demand volume ≥ the 20-day average on the break, or treat any poke above $80.96 as unconfirmed.
③ MACD

MACD crossed golden on June 30, 2026 and the spread has widened impressively since: the MACD line at 0.94 versus the signal at 0.13 leaves a histogram of +0.81 — the strongest momentum reading among this week’s setups. The cross occurred near the zero line after the June pullback, the location where golden crosses historically carry the most information, and the rising histogram says the thrust is still accelerating rather than fading. The caveat is that MACD is a trend-following measure on a chart whose ADX still reads “ranging”: in wide sideways ranges, MACD thrusts can carry price to the range ceiling and stall. Momentum is a tailwind here, not a verdict.
④ RSI

RSI(14) stands at 54.9 — comfortably positive, nowhere near the >70 overbought zone, and free of any flagged divergence. For a stock trading within about 2% of its swing high, a mid-50s RSI is actually encouraging: it means the July advance has not spent its momentum budget, and there is headroom for a breakout attempt before the tape reads stretched. The May episode is the cautionary template — RSI pushed above 70 as price tagged the low-$80s and the move stalled for a month. A breakout of $80.96 that lifts RSI into the 60s with volume behind it would look sustainable; RSI rolling back through 50 would instead signal the range-digestion path toward the $75 cluster.
⑤ Mansfield Relative Strength

Mansfield RS vs the S&P 500 reads −2.1% — still technically an underperformer, but the trajectory is the best of this week’s group. A month ago the line sat at −13.8% and a week ago at −9.0%, so the stock has clawed back +11.6 points in a month and +6.8 points in the last week alone, with a rising slope. This is what an improving laggard looks like just before a leadership test. The zero line is the gate: P spent May–early-June oscillating above and below it and was rejected, so a decisive cross and hold above zero — ideally alongside a $80.96 price breakout — would be the strongest combined signal this chart can produce. Until then, deep-pocket buyers have no proof this is more than another swing inside the range.
⑥ ATR & ADX

Risk management is where this name demands respect. ATR(14) is $4.54 — 5.72% of price, the highest volatility in this week’s selection — which means a routine two-way day moves more than many stocks do in a week, and the 2× ATR stop at $70.26 sits a full 11.4% below the close. Position size should shrink accordingly: the correct response to a wide stop is fewer shares, not a tighter, noise-vulnerable stop. ADX at 14.3 is firmly in ranging territory — despite the June–July bounce, no persistent trend has formed, which favors buying tested support over chasing strength, and warns that breakout follow-through is unproven until ADX turns up through the low 20s.
⑦ OBV (On-Balance Volume)

OBV is mildly supportive but not emphatic. On both timeframes the state is early accumulation: OBV holds above its 20-day average (by +1.9% on the 2-year window, +4.6% on 90 days) with a flat slope. Cumulative volume flow built strongly through the April–June recovery, and dips since have not broken it below the average — consistent with holders sitting rather than distributing. One shape-based caution from the 90-day chart: the July price push back toward $80.96 has not been matched by an equivalent new push in OBV, which prints a slightly lower high — a short-term non-confirmation flagged on the chart itself. It is the kind of wrinkle a single strong accumulation day would erase, but until then it echoes the volume panel’s message: the breakout still needs to be paid for.
Bull Case vs Bear Case
Bull Case
- MACD golden cross (June 30) from near the zero line with a wide, still-expanding +0.81 histogram.
- Mansfield RS repaired +11.6 points in a month and +6.8 in a week — the fastest relative improvement in this group.
- Price above SMA5, SMA20, SMA60 and both anchored VWAPs — every recent buyer cohort is in profit.
- Higher low at $69.16 (June 26) against the June range low; structure is ascending.
- OBV in early accumulation on both timeframes, above its 20-day average through every dip since April.
- RSI at 54.9 within 2% of the swing high — momentum headroom before overbought becomes a constraint.
Bear Case
- Volume at 0.55× average into a swing-high test — a breakout attempt with no fuel yet.
- 90-day OBV printed a slightly lower high against the July price push — a short-term non-confirmation at the worst spot.
- Mansfield RS is still below zero, and the May–June attempts at the zero line were rejected.
- ADX 14.3 — a ranging chart; the last two range ceilings ($87.34, $80s) turned price back hard.
- SMA20 remains below SMA60 — the intermediate-term average structure has not fully repaired.
- 5.72% daily ATR puts the 2× ATR stop 11.4% away — position risk is the largest of this week’s setups.
Scenarios
| Scenario | Probability | Path | Trigger / Invalidation |
|---|---|---|---|
| Breakout extends the recovery | ~40% | Price clears $80.96, tags the upper band at $81.53 and opens the path toward the 2-year swing high at $87.34, with RS crossing above zero. | Trigger: close above $80.96 with volume ≥ 1× the 20-day average. Invalidation: a failed break that closes back below $78.18. |
| Range digestion at the ceiling | ~40% | The $80–$81.53 zone rejects on thin volume; price retraces to the $74.75–$75.50 confluence (50% retracement, SMA20/60, 90d aVWAP) and rebuilds. | Trigger: rejection at $80.96 with volume staying below average. This path stays constructive while $73.67 (61.8%) holds on a closing basis. |
| Failed breakout, range breakdown | ~20% | Sellers reclaim the range: price loses $73.67, then the $70.26 stop and the $69.16 swing low, returning the chart to the lower half of its 2026 range. | Trigger: close below $70.26 (2× ATR stop). That is the hard exit reference for the swing thesis. |
Key Levels
| Price | Role | Basis |
|---|---|---|
| $87.34 | Resistance | 2-year swing high (May 11, 2026) — the next objective if $80.96 breaks |
| $81.53 | Resistance | Upper Bollinger band (20, 2) |
| $80.96 | Resistance | July 9 swing high — 0% of the June 26 → July 9 swing |
| $79.33 | Current | July 10, 2026 close |
| $78.18 | Support | 23.6% retracement — first shelf under price |
| $76.45 | Support | 38.2% retracement of the same swing |
| $75.06 | Support | 50% retracement — inside the SMA60 ($75.50) / 90d aVWAP ($74.90) / SMA20 ($74.75) cluster |
| $70.26 | Stop-loss | 2× ATR below the close (−11.4%); the $69.16 swing low sits just beneath |
What to Watch
- Volume on any close above $80.96 — at 0.55× average today, the breakout is unfunded; demand ≥ 1× the 20-day average.
- Mansfield RS at the zero line — a hold above zero would be this chart’s single most meaningful upgrade.
- OBV making a new high with price — erasing the short-term non-confirmation flagged on the 90-day chart.
- The $74.75–$75.50 confluence on any rejection — the difference between healthy digestion and a failed range test.
- ADX turning up through ~20 — the sign that a real trend, not another range swing, is forming.
Conclusion
Past Analyses of This Stock same ticker · newest first
This analysis is an educational interpretation of chart data and is not investment advice. Probabilities and levels are subjective estimates; every investment decision, and its outcome, is your own responsibility. Indicator values are taken from closing-price data as of July 10, 2026 and are not recalculated intraday. If a stock moves sharply on news, earnings or other fundamental catalysts, do not act on technical signals alone — check the catalyst first.
Two Week Swing · twoweekswing.com · 4,600+ stocks screened weekly