Driven Brands Holdings Inc.
$15.22 −22.9% from 52-week high
This analysis is based on closing-price data as of July 17, 2026. Whether you're researching how to buy Driven Brands Holdings Inc. stock or you've just opened a brokerage account and are trying to time an entry, here are objective support levels and stop-loss references built from the RSI, MACD and ATR indicators.
DRVN is in a repair uptrend. A violent late-February 2026 gap-down took the stock from the $16–17 area to a March low near $10.30, and since then price has climbed +55.3% off the 52-week low on a stack of higher lows, reclaiming the 20- and 60-day moving averages. Short-term momentum is constructive — a late-June MACD golden cross, RSI near 60 and on-balance volume in accumulation on both timeframes — but the stock still underperforms the Nasdaq Composite (Mansfield RS −6.39%), the latest push has come on below-average volume, and the entire zone up to $16.47 is unfilled gap territory that can act as overhead supply.
Snapshot all values from the July 17, 2026 chart data
| Metric | Value | Reading |
|---|---|---|
| Close | $15.22 | −22.9% from 52w high / +55.3% from 52w low |
| 52-week high / low | $19.74 / $9.80 | mid-range, upper half of the recovery |
| SMA 5 / 20 / 60 | $15.29 / $14.35 / $13.64 | close > SMA20 > SMA60, both rising; SMA5 a touch above the close |
| Bollinger (upper / mid / lower) | $16.47 / $14.35 / $12.23 | price in the upper half; band width 29.56% (expanded) |
| Anchored VWAP (2y) | $12.47 (anchor Feb 25, 2026) | price well above — average buyer since the gap-down is in profit |
| Anchored VWAP (90d) | $13.65 (anchor Apr 30, 2026) | price above the short-term anchor as well |
| RSI (14) | 59.9 | constructive, not overbought |
| Mansfield RS vs the Nasdaq Composite | −6.39% | underperforming, but rising (−27.14 a month ago, −8.19 a week ago) |
| MACD (12,26,9) | 0.54 / 0.48 / +0.06 | golden cross June 26, 2026; still above the signal line |
| ADX (14) | 29.9 | strong trend reading |
| ATR (14) | $0.62 (4.05% of price) | moderate daily range |
| OBV (2y / 90d) | accumulation / accumulation | above its 20-day average and rising on both timeframes |
| Volume vs 20-day avg | 0.63× (607,800 vs 958,275) | latest advance is not volume-confirmed |
| 1× / 2× ATR stop | $14.60 / $13.99 | objective invalidation references |
① Price & Moving Averages
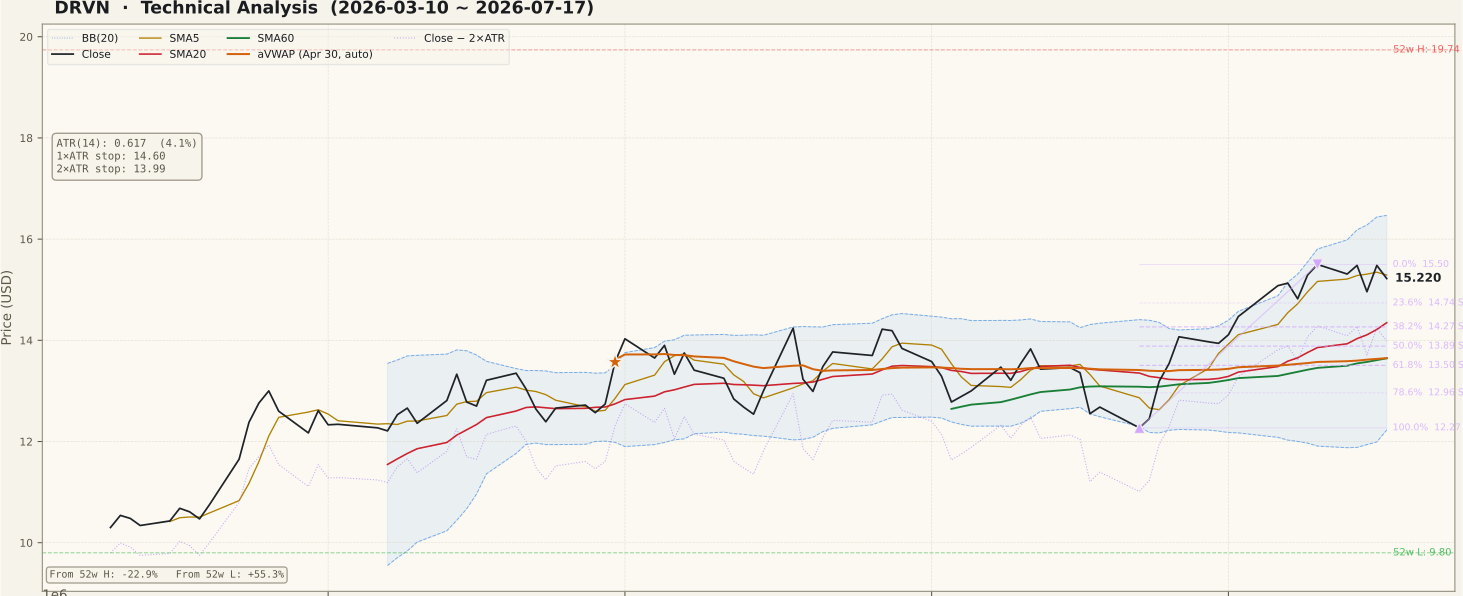
The two-year picture is dominated by one event: after topping out near the 52-week high of $19.74 in September 2025, DRVN weakened through the winter and then gapped down violently on February 25, 2026, from roughly $16.47 to $11.95, bottoming at $10.30 on March 10. Everything since has been repair work. On the 90-day chart that repair looks orderly — a sequence of higher lows from the June 22 pivot at $12.27 to the July 10 swing high at $15.50.
The moving-average structure is the core of the current setup: the close at $15.22 sits above a rising SMA20 ($14.35) which sits above a rising SMA60 ($13.64) — a bullish stack. The one blemish is that the SMA5 ($15.29) is fractionally above the close, reflecting a small stall just under the $15.50 swing high. Price also trades above both anchored VWAPs — $12.47 from the February 25 gap anchor on the long timeframe and $13.65 from the April 30 anchor on the short one — meaning the average buyer since either anchor is in profit, which tends to reduce overhead selling pressure from trapped holders.
Two caveats temper the picture. First, the February gap remains unfilled: the zone from $11.95 up to $16.47 is territory price fell through almost without trading, and the top of that gap is classic resistance. Second, at 29.56% the Bollinger bands are wide, and the upper band ($16.47) coincides almost exactly with the gap top — a double barrier overhead.
② Volume

Friday's volume of 607,800 shares was only 0.63× the 20-day average of 958,275 — and that is the main technical objection to this chart. The rally from the late-June low has carried price up roughly three dollars, but the most recent leg has printed on quiet tape. A breakout above $15.50 attempted on volume like this would be exactly the kind of unconfirmed move experienced chart readers distrust.
The 90-day panel does show sporadic accumulation-style spikes — yellow 2×-average bars in early May and again in early June near the lows — which is consistent with the OBV picture discussed below. But for the bull case to strengthen, the next push into $15.50–$16.47 needs to arrive with volume at or above the 20-day average. Until then, treat the advance as real but thinly sponsored.
③ MACD

MACD crossed above its signal line on June 26, 2026 — a golden cross that fired near the zero line after the June pullback — and the reading stands at 0.54 versus a signal of 0.48, histogram +0.06. The cross has now been in force for three weeks and price has followed through, which validates it as more than a one-day flicker.
The nuance is in the histogram shape: on the chart the green bars peaked in mid-July and the most recent bars are shorter. That is momentum decelerating, not reversing — a normal feature of a pause under resistance — but it means the burden of proof shifts to the next few sessions. A fresh histogram expansion alongside a close above $15.50 would confirm continuation; continued shrinkage toward zero would set up a dead cross and argue for a deeper pullback toward the $14.27–$14.74 support shelf.
④ RSI

RSI(14) sits at 59.9 — firmly in the bullish half of the range but comfortably below the 70 overbought line. Through the 90-day window RSI has oscillated between roughly the low 40s and the low 70s, holding above oversold territory the entire time, which is characteristic of a market in a corrective-to-early-uptrend regime rather than a distressed one.
No divergence is flagged on either timeframe: the July price highs came with RSI highs, so momentum has confirmed price so far. A reading near 60 leaves room for another leg up before the indicator gets stretched. The pattern to watch for is a bearish divergence forming if price grinds to a marginal new high above $15.50 while RSI prints a lower high — none exists today, but that is the classic way a repair rally announces exhaustion, and it is worth checking before chasing any breakout.
⑤ Mansfield Relative Strength vs the Nasdaq Composite

Mansfield RS versus the Nasdaq Composite reads −6.39% — still negative, meaning DRVN has underperformed the index over the measurement window. This is the single most important brake on enthusiasm here: everything else on the short-term chart is improving, but the stock has not yet earned outperformer status.
The direction of travel, however, is strongly positive. A month ago the reading was −27.14; a week ago it was −8.19. That is an improvement of about +20.7 points over the month and +1.8 over the week — a negative-but-improving profile on both horizons, with the line clearly rising toward zero on the chart. In Stan Weinstein's framework, an RS line crossing above zero from below often accompanies a durable stage change. It has not crossed yet. Until it does, this remains a recovering laggard rather than a leader, and position sizing should respect that.
⑥ ATR & ADX

ATR(14) is $0.62, or about 4.05% of price — an elevated but manageable daily range, well off the panic levels of March. For position sizing, that ATR puts the 1× stop reference at $14.60 and the 2× stop at $13.99, roughly 8.1% below the close. The 2× level sits just under the SMA20/Bollinger-mid shelf at $14.35, which makes it a structurally sensible invalidation point rather than an arbitrary one.
ADX(14) reads 29.9 — a strong-trend reading, and on the 90-day panel it has been turning up from its early-July trough. Remember that ADX measures strength, not direction; here it is rising while price rises, so it is currently grading the recovery uptrend as strengthening. A continued ADX rise with price above the 20-day average is trend-follower-friendly; an ADX rollover below 25 would downgrade this to a range market where fading the extremes works better than chasing breakouts.
⑦ OBV (On-Balance Volume)

OBV is in an accumulation state on both timeframes — above its 20-day average and rising, with the OBV-vs-average spread at +13.0% on the two-year series and +9.72% on the 90-day series. On the short-term panel OBV has pushed to new highs for the window alongside price, so there is no bearish non-confirmation: the up days, when they come, are attracting the bigger share of volume.
The two-year series adds useful context: absolute OBV (−17.3M) is still negative and well below where it stood before the February collapse, meaning the cumulative distribution from that event has only been partially rebuilt. So the honest summary is layered — short- and medium-term money flow favors the buyers, while the long-term ledger is still healing. That combination is typical of a stock in the middle innings of a repair, and it is consistent with the price chart's position inside the unfilled gap.
Bull Case vs Bear Case
Bull Case
- Bullish moving-average stack: close above a rising SMA20 ($14.35) above a rising SMA60 ($13.64) — the recovery trend is structurally intact.
- MACD golden cross from June 26 remains in force, with MACD (0.54) still above its signal (0.48) and price following through.
- OBV in accumulation on both timeframes (+13.0% / +9.72% vs its 20-day average), confirming the July price highs.
- Relative strength improving fast: Mansfield RS has climbed from −27.14 to −6.39 in a month and is rising toward the zero line.
- ADX near 30 and turning up grades the uptrend as strong, and price holds +55.3% above the 52-week low on higher lows.
- Price is above both anchored VWAPs ($12.47 from the Feb 25 anchor, $13.65 from Apr 30), so the average post-crash buyer is in profit — less trapped supply below.
Bear Case
- Mansfield RS is still negative (−6.39%): DRVN remains a Nasdaq underperformer — improvement is not yet leadership.
- Friday's volume was just 0.63× the 20-day average; the latest leg up lacks volume confirmation.
- The February 25 gap ($11.95–$16.47) is unfilled — the whole zone overhead up to $16.47 can act as supply, reinforced by the upper Bollinger band at the same price.
- Price has stalled under the July 10 swing high at $15.50, with the SMA5 ($15.29) now a touch above the close and the MACD histogram narrowing.
- Still −22.9% below the 52-week high of $19.74; long-term OBV remains negative in absolute terms, so the crash-era distribution is only partly rebuilt.
- The February collapse was a news-driven shock, not a technical event — whatever caused it may still overhang the story, and charts alone cannot price that.
Scenarios
| Scenario | Probability | Path | Trigger / Invalidation |
|---|---|---|---|
| Continuation into the gap | ~45% | Holds the $14.74 shelf, clears the $15.50 swing high, and presses through the 78.6% retracement at $15.64 toward the gap top / upper band at $16.47. | Trigger: daily close above $15.50 with volume at or above the 20-day average. Invalidated by a close back below $14.74. |
| Sideways digestion | ~35% | Repeated stalls under $15.50–$15.64 on quiet volume; price drifts back to the $14.27–$14.74 Fibonacci shelf and the rising SMA20 while the MACD histogram fades toward zero. | Trigger: another rejection at $15.50 on sub-average volume. Resolves per whichever boundary breaks with volume. |
| Recovery fails | ~20% | Loses the SMA20 ($14.35) and the 38.2% support at $14.27, momentum rolls over into a MACD dead cross, and price sinks through the 2×ATR stop toward the 50–61.8% zone at $13.89–$13.50. | Trigger: daily close below $13.99 (2×ATR stop). That close invalidates the entire long setup. |
Key Levels
| Price | Role | Basis |
|---|---|---|
| $16.47 | Resistance | Top of the unfilled Feb 25, 2026 gap-down; upper Bollinger band at the same price |
| $15.64 | Resistance | 78.6% retracement of the Feb–Mar down-swing ($17.09 → $10.30) |
| $15.50 | Resistance | July 10 swing high — 0% of the current up-swing |
| $15.22 | Current close | As of July 17, 2026 |
| $14.74 | Support | 23.6% retracement of the June–July up-swing ($12.27 → $15.50) |
| $14.35 | Support | Rising SMA20 / Bollinger midline, backed by the 38.2% retracement at $14.27 |
| $13.99 | Stop-loss reference | 2×ATR stop — objective invalidation for the recovery setup (~8.1% below the close) |
What to Watch
- Volume on any push through $15.50. A close above the July 10 high on at least average volume (roughly 958,000 shares) opens the $15.64–$16.47 gap-fill zone; the same move on 0.6× volume deserves skepticism.
- The Mansfield RS zero line. A cross from −6.39% into positive territory versus the Nasdaq Composite would upgrade DRVN from recovering laggard to outperformer — the single strongest confirmation this chart could print.
- The $14.27–$14.74 shelf. Two Fibonacci supports plus the rising SMA20 cluster here; orderly pullbacks that hold this zone keep the trend healthy, while a close below it puts the 2×ATR stop in play.
- MACD histogram direction. Re-expansion of the green bars confirms continuation; continued shrinkage warns of a dead cross and a deeper consolidation.
- The catalyst behind the February 25 gap. Confirm what drove the collapse and whether it is resolved — an unfilled gap of that size is as much a fundamental question as a technical level.
Conclusion
Past Analyses of This Stock same ticker · newest first
This analysis is an educational interpretation of chart data and is not investment advice. Probabilities and levels are subjective estimates; every investment decision, and its outcome, is your own responsibility. Where a sharp price move appears to be news-driven — as with the February 2026 gap in this stock — technical signals alone are not a sufficient basis to buy or sell; always check the underlying fundamental catalyst first.
Two Week Swing · twoweekswing.com · 4,600+ stocks screened weekly