DexCom, Inc.
$83.45 −4.1% from 52-week high · +54.2% above 52-week low
This analysis is based on closing-price data as of July 31, 2026. Whether you're researching how to buy DexCom, Inc. stock or you've just opened a brokerage account and are trying to time an entry, here are objective support levels and stop-loss references built from the RSI, MACD and ATR indicators.
For most of the past two years DXCM has been a wide, directionless range: repeated failures in the mid-$80s, a slide to a $54.11 fifty-two-week low late in 2025, and a slow repair through the first half of 2026. That range was broken in a single session. On July 31 the stock gapped away from the prior day's territory, closed at $83.45 on 2.47x its 20-day average volume, and pushed Mansfield relative strength from negative to +11.58% versus the Nasdaq Composite in one week. The structure is now genuinely bullish — but essentially all of it was created by one bar, and nothing in this chart data identifies what caused it. That distinction shapes everything below.
Snapshot all values from chart JSON, July 31, 2026
| Item | Value | Reading |
|---|---|---|
| Close | $83.45 | −4.1% from 52w high, +54.2% above 52w low |
| 52-week high / low | $87.00 / $54.11 | back at the top of the two-year range |
| SMA 5 / 20 / 60 | $76.27 / $74.55 / $71.15 | bullish stack — but close is far above all three |
| Bollinger (upper / mid / lower) | $80.16 / $74.55 / $68.95 | width 15.03% — close is outside the upper band |
| aVWAP 90d (anchor May 15, 2026) | $72.21 | price well above — recent buyers in profit |
| aVWAP 2y (anchor Oct 31, 2025) | $67.16 | long-term anchored buyers also in profit |
| RSI(14) | 68.57 | just under the 70 overbought threshold; no divergence flagged |
| Mansfield RS vs the Nasdaq Composite | +11.58% | outperforming and rising (prev week −3.56, prev month −9.33) |
| MACD (12,26,9) | 1.38 / 0.87 / +0.51 | golden cross dated July 31, above zero |
| ADX(14) | 16.28 | ranging / weak — no established trend strength yet |
| ATR(14) | $3.19 (3.82%) | elevated daily range — size positions accordingly |
| OBV | 2y: early accumulation (+35.21% vs MA20) / 90d: early accumulation (+31.75% vs MA20) | above MA20 on both frames, but slope flat |
| Volume vs 20-day avg | 2.47x | 11,980,700 shares vs a 4,856,360 average |
| ATR stops (1x / 2x) | $80.26 / $77.08 | objective invalidation references |
① Price & Moving Averages
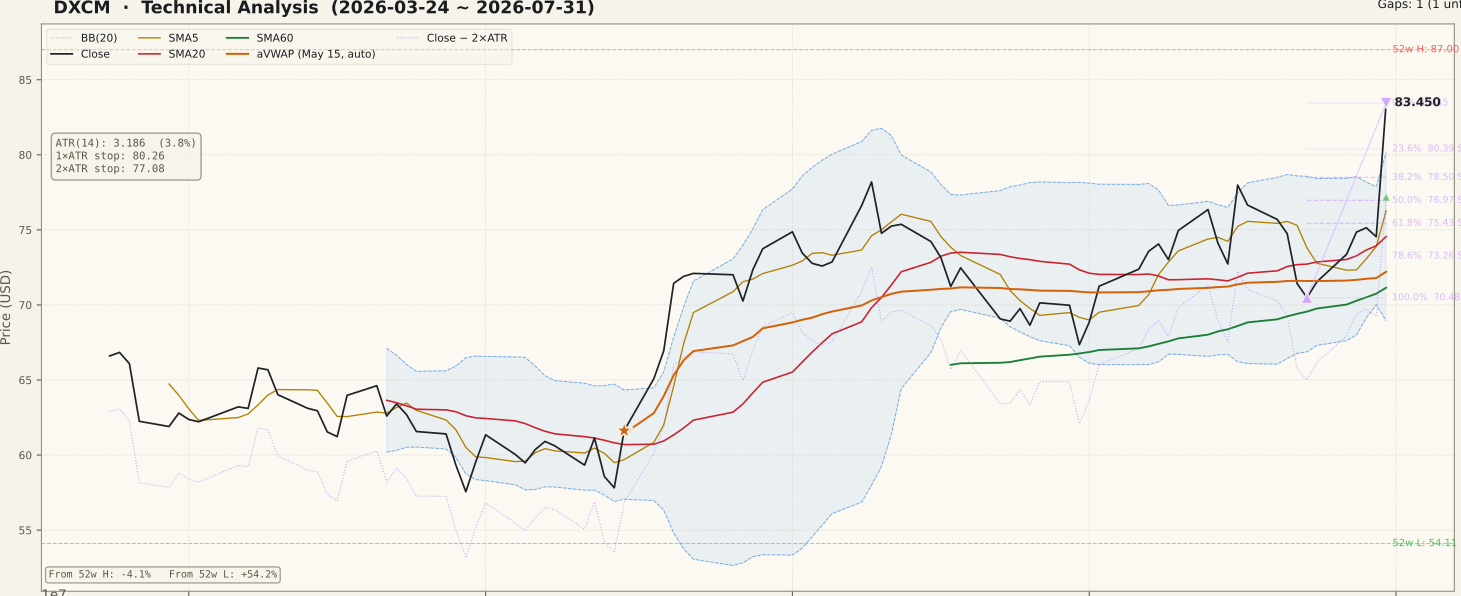
The 90-day chart shows a stock that spent June and July grinding sideways in the low-to-mid $70s before a vertical July 31 bar carried it to $83.45. The moving-average stack is bullish — close above SMA5 ($76.27), SMA20 ($74.55) and SMA60 ($71.15), all sloping up — but read the distances, not just the order: the close sits more than seven dollars above SMA5 and outside the Bollinger upper band at $80.16, which is a stretched condition rather than a comfortable one. The July 31 session also left an unfilled gap at $74.87–$79.50, which is now the most important support shelf on the chart, and the Fibonacci grid drawn on the July 23 to July 31 up-swing ($70.48 to $83.45) marks first retracement support at $80.39 (23.6%), $78.50 (38.2%) and $76.97 (50%). On the two-year frame the context is sobering: the $87.00 fifty-two-week high is only 4.1% overhead, and the mid-$80s is precisely where this stock has been turned back repeatedly since 2024. Price is at the top of a two-year range, not in open space.
② Volume

The July 31 bar traded 11,980,700 shares against a 20-day average of 4,856,360 — a ratio of 2.47x and the largest volume bar on the 90-day chart. On the usual checklist this is the good kind of confirmation: the common beginner error is trusting a breakout that happens on below-average volume, and this one clearly is not that. The harder question is what the volume represents. A one-session gap of this size accompanied by a volume multiple this large is the signature of a news event being priced in, not of gradual accumulation by buyers who have been building a position for weeks. The chart data available here contains no fundamental information, so the cause cannot be identified from it — and late July sits squarely inside the U.S. earnings window. Confirm what happened before treating the volume as a technical endorsement.
③ MACD

MACD (1.38) crossed above its signal line (0.87) with a histogram of +0.51, and the cross is dated July 31 — the same session as the gap. That timing matters. A golden cross that forms over several sessions describes momentum that built gradually; a cross created by one enormous bar is really the indicator catching up to a price shock. The cross does sit above the zero line, which historically favours continuation over a false start, and the 90-day chart shows the previous attempt in June rolled over into a dead cross in July, so this is the second try at the same momentum turn. Treat it as supporting evidence rather than as the reason for the move.
④ RSI

RSI(14) reads 68.57, just below the 70 overbought line, after spending most of July between 45 and 60. No divergence is flagged in the data and no divergence peaks are provided, so there is nothing here that argues for an exhaustion top. Note what a single large bar does to this indicator: it can lift RSI more than ten points at once, which means the reading describes the shock, not a sustained momentum build. Overbought is not a sell signal in a fresh advance — strong moves routinely hold RSI above 70 for weeks — but entering at 68.57 immediately after a gap means paying for the entire move and accepting an unusually wide stop.
⑤ Mansfield Relative Strength

Mansfield RS versus the Nasdaq Composite is +11.58%, and the path there is the most striking number on the page: a week ago the reading was −3.56 and a month ago −9.33, so the stock has gained 15.15 points in a week and 20.92 points in a month, crossing from underperformance into outperformance within the last five sessions. In Mansfield terms this is positive and accelerating, the quadrant that usually accompanies emerging leadership. The caveat is the same one that runs through this whole chart: a Mansfield line moves with price, so a single-session repricing produces exactly this shape. What separates real leadership from a one-bar artefact is whether the line keeps its slope over the following two to three weeks without price giving the gap back.
⑥ ATR & ADX

ADX sits at 16.28 — ranging and weak, well under the 20 threshold. This is the clearest internal tension on the chart: price has broken out, but the trend-strength gauge still describes a range-bound stock, because ADX needs a sequence of directional sessions and it has had exactly one. ADX measures strength, not direction, so a low reading is not bearish; it simply means the breakout has not yet earned trend status. ATR at $3.19 is 3.82% of the share price, so the 1x ATR reference sits at $80.26 and the 2x ATR stop at $77.08, roughly 7.6% below the close. Note where that stop lands: inside the July 31 gap zone, which means a partial gap fill and a mechanical exit are the same event.
⑦ OBV (On-Balance Volume)

OBV is tagged early accumulation on both timeframes — above its 20-day average by 35.21% on the two-year frame (46,140,500 vs 34,124,170) and by 31.75% on the 90-day frame (49,858,400 vs 37,842,070) — but the slope is flagged flat on both, not rising. That pairing is worth sitting with: the cumulative volume line is comfortably above its average because of the July 31 surge, yet it has not been trending higher into the move. It is an accumulation state that has been delivered in one instalment. If price extends above $83.45 and OBV makes a matching new high, the buying pressure is real; if price grinds higher while OBV stays flat, the follow-through is being supplied by fewer and fewer buyers.
Bull Case vs Bear Case
Bull Case
- Full bullish stack: close $83.45 above SMA5 $76.27 > SMA20 $74.55 > SMA60 $71.15, all rising
- Mansfield RS crossed into outperformance at +11.58%, up 15.15 pts in a week and 20.92 pts in a month
- The move came on 2.47x average volume (11,980,700 vs 4,856,360) — not a low-volume breakout
- MACD golden cross dated July 31 above the zero line, histogram +0.51
- Price above both anchored VWAPs (90d $72.21, 2y $67.16) — anchored buyers are in profit
- Unfilled July 31 gap at $74.87–$79.50 creates a defined support shelf beneath the advance
Bear Case
- Practically the entire advance is one session — a gap plus a volume surge whose cause is not identifiable from this chart data
- ADX 16.28 is ranging / weak: no established trend strength stands behind the breakout
- Close $83.45 is outside the Bollinger upper band ($80.16) and over seven dollars above SMA5 — stretched
- The $87.00 fifty-two-week high is only 4.1% overhead, and the mid-$80s has repeatedly capped this stock since 2024
- OBV slope is flat on both frames despite the volume spike — accumulation is early, not confirmed
- Gaps of this type are frequently retested; a fill toward $74.87 would erase the move and put price back under SMA5
Scenarios
| Scenario | Probability | Path | Trigger / Invalidation |
|---|---|---|---|
| Gap holds, range high tested | ~35% | The gap is not filled, price consolidates above the $79.50 gap top and $80.39 Fibonacci shelf, then works toward the $87.00 fifty-two-week high. | Trigger: daily closes holding above $80.39 followed by a close above $83.45 with volume above the 20-day average. Invalidated by a close below $77.08. |
| Partial fill and rebuild | ~40% | Price retraces into the $80.39–$76.97 Fibonacci band and the upper half of the gap zone, cools RSI from 68.57, lets SMA5 catch up, then retries. | Trigger: rejection under $83.45 on fading volume. Constructive while daily closes hold above $77.08. |
| Full gap fill | ~25% | Sellers use the spike for liquidity, the whole $79.50–$74.87 gap fills, and price returns to the SMA20 / aVWAP 90d zone at $74.55–$72.21. | Trigger: daily close below the 2x ATR stop at $77.08 — the setup is negated there. |
Key Levels
| Price | Role | Basis |
|---|---|---|
| $87.00 | Resistance | 52-week high — the ceiling of the two-year range |
| $83.45 | Current | Close, July 31, 2026 · Fibonacci 0% (swing high) |
| $80.39 | Support | Fibonacci 23.6% retracement, clustered with the 1x ATR reference $80.26 and the Bollinger upper band $80.16 |
| $79.50–$74.87 | Support | Unfilled July 31 gap zone — the structural floor of the move |
| $78.50 | Support | Fibonacci 38.2% retracement of the July 23–31 up-swing |
| $77.08 | Stop-loss | 2x ATR below close — objective invalidation, inside the gap zone |
| $76.97 | Support | Fibonacci 50% retracement, just above SMA5 $76.27 |
What to Watch
- The catalyst first. A one-session gap on 2.47x volume during earnings season is almost always news-driven, and this chart data cannot tell you what the news was. Identify it before you read anything else on this page as an entry case.
- Whether the $79.50–$74.87 gap stays unfilled. Holding the upper edge keeps the structure intact; a full fill returns the stock to the range it just left.
- ADX rising through 20. At 16.28 the breakout has no trend strength behind it yet — a rising ADX over the next two weeks is what would convert a one-bar move into a trend.
- OBV slope. It is flat on both timeframes; a rising OBV alongside any push above $83.45 confirms follow-through buying, while a flat OBV into higher prices would be a warning.
- A daily close below $77.08 (2x ATR stop) — mechanical exit, and simultaneously a partial gap fill.
Conclusion
Past Analyses of This Stock same ticker · newest first
This analysis is an educational interpretation of chart data and is not investment advice. Probabilities and levels are subjective estimates; every investment decision, and its outcome, is your own responsibility. A bottoming signal is not a buy signal, and a single-session price shock is not a trend. All figures are derived from closing-price data as of July 31, 2026 and may be outdated by the time you read this.
Two Week Swing · twoweekswing.com · 4,600+ stocks screened weekly