Damora Therapeutics, Inc.
$28.82 −24.8% from 52-week high ($38.33)
This analysis is based on closing-price data as of July 24, 2026. Whether you're researching how to buy Damora Therapeutics, Inc. stock or you've just opened a brokerage account and are trying to time an entry, here are objective support levels and stop-loss references built from the RSI, MACD and ATR indicators.
DMRA is one of the more dramatic charts on the Nasdaq over the past two years: after basing near $2–$3 for most of 2025, a series of enormous upside gaps in October and November 2025 repriced the stock more than tenfold, and it now trades at $28.82 — up +1,076.3% from its 52-week low but still −24.8% below its 52-week high of $38.33. The June–July swing from $20.07 to $32.99 is now pulling back on quiet volume, which is the setup that put it on this week's screen — but a fresh MACD dead cross, a confirmed bearish RSI divergence, and OBV slipping below its 20-day average say this pullback deserves respect, not a reflexive dip-buy. The lens for everything below: a strongly outperforming stock digesting a fast advance, with the burden of proof on the buyers to hold the retracement shelf.
Snapshot all values from the July 24, 2026 close
| Item | Value | Read |
|---|---|---|
| Close | $28.82 | Below SMA5/SMA20, above SMA60 |
| 52-week high / low | $38.33 / $2.45 | −24.8% from high · +1,076.3% from low |
| SMA5 / SMA20 / SMA60 | $30.79 / $29.25 / $25.35 | Short averages overhead; SMA60 rising below |
| Bollinger (20) | $33.95 / $29.25 / $24.54 | Width 32.16% — wide, high-volatility regime |
| aVWAP 90d (Jun 26 anchor) | $27.02 | Price above — recent buyers still in profit |
| aVWAP 2y (Nov 10, 2025 anchor) | $23.06 | Price above — post-gap holders in profit |
| RSI(14) | 52.09 | Bearish divergence flagged (Jul 9 vs Jul 21 peaks) |
| Mansfield RS (vs Nasdaq Composite) | +42.86% | Outperforming · week −13.8pt (slowing) · month +21.2pt |
| MACD (12,26,9) | 1.60 / signal 1.82 / hist −0.22 | Dead cross on Jul 23 — fresh |
| ADX(14) | 26.29 | Strong trend (strength, not direction) |
| ATR(14) | $2.58 (8.94% of price) | Very high daily range — size positions accordingly |
| OBV | 90d: 7,057,700 (−13.43% vs MA20) · 2y: 230,936,740 (−0.47%) | Early distribution on both timeframes |
| Volume (last / 20-day avg) | 564,900 / 945,170 (0.60×) | Pullback on below-average volume |
| 1× / 2× ATR stop | $26.24 / $23.67 | 2×ATR stop ≈ −17.9% from close |
① Price & Moving Averages
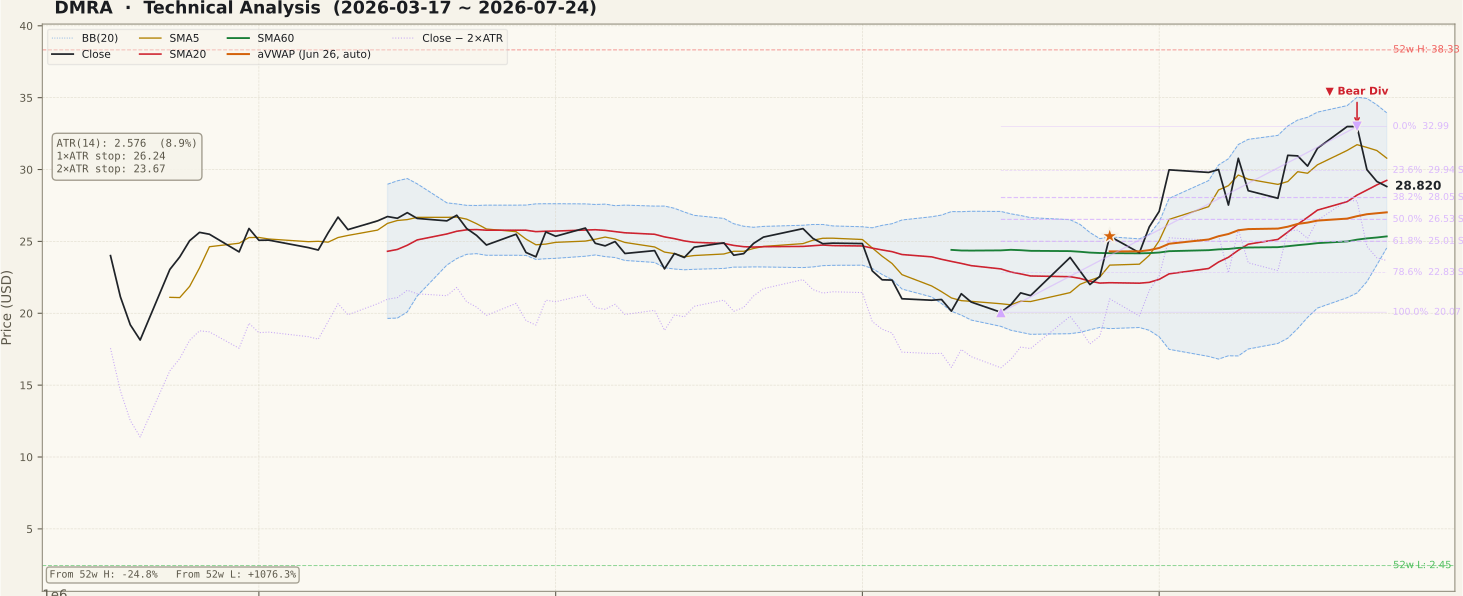
The two-year picture is a step-function: a long flat base in the low single digits, then successive upside gaps in late 2025 (three of them still unfilled far below, at roughly $3.00–$3.81, $4.01–$16.40 and $5.47–$15.06) that established an entirely new price regime between roughly $20 and $38. Within the last 90 days the stock built a three-month shelf near $25, dipped to $20.07 on June 15, then ran to $32.99 by July 21 — and has now pulled back to $28.82, slipping below the SMA5 ($30.79) and SMA20 ($29.25) while holding well above the rising SMA60 ($25.35). The Bollinger Bands are wide (width 32.16%), consistent with a stock whose average daily range is near 9%. On the Fibonacci grid of the June–July up-swing, price sits between the 23.6% retracement ($29.94, now overhead) and the 38.2% retracement ($28.05) — a normal first pullback zone, as long as it holds.
② Volume

Friday printed 564,900 shares against a 20-day average of 945,170 — a 0.60× ratio. A pullback on fading volume is the least alarming kind: it suggests sellers are not pressing, merely that buyers have stepped back after a fast run. The standout on the 90-day panel is the very large late-June spike (coinciding with the June 26 aVWAP anchor), which marked the launch of the current leg. The caveat cuts both ways, though — any attempt to reclaim the highs on volume this thin would be a low-conviction breakout, and the classic beginner mistake here is trusting a retest of $32.99 that arrives with Vol/Avg below 1.
③ MACD

MACD crossed below its signal line on July 23 — a dead cross only one session old at the Friday close — with MACD at 1.60, signal at 1.82, and the histogram newly negative at −0.22. Context matters: this cross is occurring high above the zero line after a month-long advance, which is the profile of momentum cooling from an elevated state rather than a downtrend asserting itself. Still, a fresh dead cross at a high level frequently precedes several sessions to a few weeks of sideways or lower price action while the averages compress. Momentum has flipped from tailwind to mild headwind until the histogram turns back up.
④ RSI

RSI(14) sits at 52.09 — back to neutral after spending mid-July above 70. The more important message is the flagged bearish divergence, and this one is specific: on July 9 price peaked at $30.78 with RSI at 70.84, then on July 21 price made a higher high at $32.99 while RSI printed a lower high of 66.64. Price pushed to new swing highs on less internal strength — a textbook warning that the leg was tiring, and the pullback since has been the follow-through. A divergence is a possibility of reversal, not a verdict: RSI holding the 40–50 zone on this retreat would actually re-arm the bull case, while a break toward 30 would say the correction is deeper than a routine reset.
⑤ Mansfield Relative Strength

Mansfield RS vs the Nasdaq Composite stands at +42.86% — firmly in outperform territory, and it has been above zero for the entire 90-day window. The rate of change tells a two-speed story: a week ago the reading was 56.70, so the weekly change is −13.8 points — outperformance is slowing near-term as the pullback unfolds. A month ago it was 21.69, so the monthly change is +21.2 points — the bigger trend of market-beating strength is intact and accelerating on that horizon. This is the normal signature of a leader taking a breather rather than one being abandoned; it would turn genuinely concerning only if the weekly bleed continued toward the zero line.
⑥ ATR & ADX

ATR(14) is $2.58, or 8.94% of price — an extremely wide daily range that dictates everything about position sizing here. A "normal" day in DMRA moves as much as a bad month in a mega-cap, so stops must live far from price: the 1×ATR reference is $26.24 and the 2×ATR stop is $23.67, roughly −17.9% below Friday's close. If that loss is too large for your account, the correct response is a smaller position, not a tighter stop that normal noise will hit. ADX(14) at 26.29 reads "strong trend" — remember ADX measures strength, not direction, so it is currently certifying the June–July advance while momentum tools warn that advance is cooling.
⑦ OBV (On-Balance Volume)

Both timeframes carry an early distribution tag — OBV below its 20-day average with a flat slope — but the degree differs and both are worth stating. On the 90-day view OBV is 7,057,700 versus an MA20 of 8,152,365, a −13.43% shortfall: the cumulative volume line has clearly stalled while price hovers only modestly off its highs, meaning the recent leg is not being confirmed by accumulation. On the two-year view the gap is a marginal −0.47% (230,936,740 vs 232,031,405) — the huge post-gap accumulation base from late 2025 is essentially intact. Short-term money is leaking out; long-term holders have not left.
Bull Case vs Bear Case
Bull Case
- Mansfield RS +42.86% vs the Nasdaq Composite, above zero all quarter, and up +21.2 points month-over-month.
- Price holds above the rising SMA60 ($25.35) and above both anchored VWAPs ($27.02 90d, $23.06 2y) — every major buyer cohort is still in profit.
- The pullback is running on 0.60× average volume — no evidence of urgent selling.
- Price is holding the upper half of the Fibonacci grid, between the 23.6% ($29.94) and 38.2% ($28.05) retracements — the shallowest pullback zone.
- ADX 26.29 confirms a strong established trend, and RSI has reset from 70+ to a neutral 52 without approaching oversold.
- No unfilled overhead gaps in the 90-day window; all three unfilled two-year gaps sit far below as support-side structure.
Bear Case
- Fresh MACD dead cross on July 23 with the histogram flipping negative — momentum has rolled over.
- Confirmed bearish RSI divergence: price higher high $30.78 → $32.99 (Jul 9 → Jul 21) against RSI lower high 70.84 → 66.64.
- OBV in early distribution on both timeframes, with the 90-day line −13.43% below its MA20 — the last leg up was not accumulated.
- Weekly RS change is −13.8 points — relative outperformance is slowing right now.
- Close is below both the SMA5 ($30.79) and SMA20 ($29.25), turning the 23.6% level ($29.94) and SMA20 into an overhead supply band.
- ATR at 8.94% of price and a 32% Bollinger width mean even "normal" downside follow-through is violent; the stock remains −24.8% below its 52-week high.
Scenarios
| Scenario | Probability | Path | Trigger / Invalidation |
|---|---|---|---|
| Shallow pullback, trend resumes | ~40% | Price stabilizes between the 38.2% retracement ($28.05) and the 90d aVWAP ($27.02), reclaims the SMA20 ($29.25) and 23.6% level ($29.94), then retests the $32.99 swing high. | Trigger: daily close back above $29.94 with Vol/Avg ≥ 1. Invalidated by a close below $27.02. |
| Deeper retracement, then rebase | ~35% | The divergence and dead cross carry price into the 50–61.8% zone ($26.53–$25.01), where the rising SMA60 ($25.35) converges; a quieter base forms there over several weeks. | Trigger: loss of $28.05 and $27.02 on expanding volume. Invalidated (for the rebase) by a close below $25.01. |
| Distribution deepens, swing fails | ~25% | OBV distribution accelerates, the 61.8% level and 2×ATR stop ($23.67) give way, and price works back toward the June 15 swing low at $20.07. | Trigger: daily close below $23.67. The up-swing structure is fully invalidated below $20.07. |
Key Levels
| Price | Role | Basis |
|---|---|---|
| $32.99 | Resistance | Swing high (Jul 21) · 0% of the up-swing |
| $29.94 | Support level, currently overhead | 23.6% Fibonacci retracement — first reclaim target |
| $29.25 | Resistance (near-term) | SMA20 / Bollinger mid-band |
| $28.82 | Current price | Jul 24 close |
| $28.05 | Support | 38.2% Fibonacci retracement of the $20.07→$32.99 swing |
| $26.53 | Support | 50% Fibonacci retracement · near 1×ATR stop ($26.24) |
| $23.67 | Stop-loss | 2×ATR below close (≈ −17.9%) · objective invalidation |
What to Watch
- The $28.05 / $27.02 shelf — the 38.2% retracement plus the 90-day aVWAP. Holding this zone on light volume keeps the shallow-pullback scenario alive; losing it on heavy volume points to the 50–61.8% zone.
- A reclaim of $29.25–$29.94 (SMA20 and the 23.6% level) — the first hard evidence that the pullback is complete. Check the Vol/Avg ratio on that day; below 1× it proves little.
- OBV vs its 20-day average — the early-distribution tag clearing (OBV back above MA20) would neutralize the most persistent bearish signal on this chart.
- MACD histogram direction — a shrinking negative histogram within days would mark the dead cross as a pause; a deepening one confirms the correction.
- Weekly Mansfield RS change — another double-digit weekly drop would say leadership is genuinely eroding, not just resting.
Conclusion
Past Analyses of This Stock same ticker · newest first
This analysis is an educational interpretation of chart data and is not investment advice. Probabilities and levels are subjective estimates; every investment decision, and its outcome, is your own responsibility. Technical signals alone are never a sufficient reason to buy a stock that has just experienced a major fundamental repricing — always check the underlying catalysts and filings first.
Two Week Swing · twoweekswing.com · 4,600+ stocks screened weekly