Columbia Financial, Inc.
This analysis is based on closing-price data as of July 17, 2026. Whether you're researching how to buy Columbia Financial stock or you've just opened a brokerage account and are trying to time an entry, here are objective support levels and stop-loss references built from the RSI, MACD and ATR indicators.
Columbia Financial has climbed 71.4% off its 52-week low of $13.66 and closed July 17 at $23.42, within 2.8% of the 52-week high of $24.09, after a single-session surge on 8.8x average volume — the largest volume bar of the past two years. Relative strength versus the Nasdaq Composite is not just positive but accelerating (Mansfield RS +26.3%, up 14.6 points in a week), a June 29 MACD golden cross is still widening, and on-balance volume is in clear accumulation. The caution flags are equally concrete: RSI at 78.5 is deep in overbought territory, the close sits above the upper Bollinger Band, and a volume spike of this size usually has a news catalyst behind it — strength worth respecting, but a poor place to chase without a plan.
Snapshot all values from the July 17, 2026 chart data
| Close | $23.42 | 52-week high / low | $24.09 (-2.8%) / $13.66 (+71.4%) |
|---|---|---|---|
| SMA5 / SMA20 / SMA60 | $22.21 / $21.11 / $20.17 | Bollinger (20) | $19.20 – $23.02, mid $21.11, width 18.09% |
| aVWAP (2y) | $19.94 (anchor Feb 2, 2026) | aVWAP (90d) | $22.38 (anchor Jun 26, 2026) |
| RSI (14) | 78.5 — overbought | Mansfield RS (vs Nasdaq Composite) | +26.34% — outperform, rising slope |
| MACD (12,26,9) | 0.62 vs signal 0.42, histogram +0.20 — golden cross Jun 29, 2026 | ADX (14) | 22.7 — emerging trend |
| ATR (14) | $0.63 (2.68% of price) | Volume vs 20-day avg | 8.81x (7,472,100 vs 847,835) |
| OBV (2y) | Accumulation — above rising 20-day MA, +230.88% | OBV (90d) | Accumulation — above rising 20-day MA, +135.10% |
| 1×ATR stop | $22.79 | 2×ATR stop | $22.16 |
① Price & Moving Averages
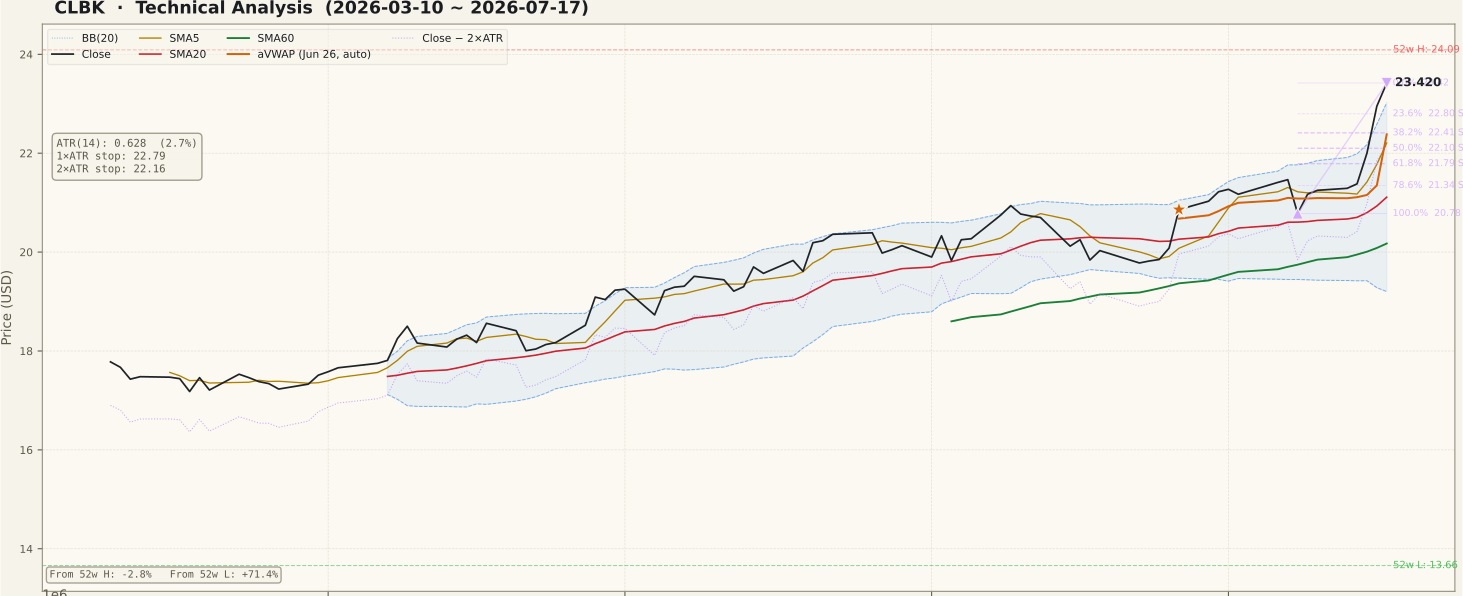
The two-year chart tells a clean stage story: CLBK based between roughly $14 and $17 through most of 2025, broke higher in early February 2026, and has since climbed in an orderly channel above a rising SMA60. The 90-day window shows that channel steepening — a steady grind along the upper half of the Bollinger Bands — and then a vertical thrust on July 17 to $23.42. The moving averages are in full bullish alignment, Close > SMA5 ($22.21) > SMA20 ($21.11) > SMA60 ($20.17), all rising, and price is comfortably above both anchored VWAPs: the two-year anchor from February 2 at $19.94 and the 90-day anchor from June 26 at $22.38, so the average buyer on both horizons is in profit. The stretch is the issue: the close is above the upper Bollinger Band at $23.02 and nearly 11% above the 20-day average. Measured against the July 8 to July 17 up-swing ($20.78 to $23.42), the first retracement supports sit at $22.80 (23.6%) and $22.41 (38.2%) — the latter almost exactly on the 90-day aVWAP, a natural first test zone for any cool-off.
② Volume

The July 17 session traded 7,472,100 shares against a 20-day average of 847,835 — a 8.81x spike that dwarfs every other bar on the two-year chart. On its face this is textbook confirmation: an advance to the top of the range on the heaviest volume of the entire uptrend means real buying, not drift. But a one-day volume explosion of this magnitude in a thrift holding company is rarely spontaneous — it is the signature of a news event (earnings, corporate action, or deal speculation), none of which is visible in chart data. That cuts both ways: catalyst-driven volume can mark the start of a re-rating or a climactic burst that fades within days. Average dollar volume before the spike was roughly $18 million a day — adequate liquidity, though fills can slip when the tape moves this fast. The follow-through matters more than the bar itself: sustained above-average volume on further strength would validate the move, while an immediate return to sub-average volume would suggest a one-off event.
③ MACD

MACD printed a golden cross on June 29, 2026 and the signal has only strengthened since: the MACD line at 0.62 is pulling away from the signal at 0.42, with the histogram at +0.20 and widening into the July 17 spike. The cross occurred well above the zero line, which marks it as a re-acceleration within an existing uptrend rather than an early-stage turn — momentum was already positive and has now gone near-vertical. The caveat with momentum this extended is mechanical: after a one-day thrust, even a sideways pause will compress the histogram and can print a reflexive dead cross without any real damage to the trend. Read the next histogram contraction, if it comes, in context — a shrinking green histogram while price holds above $22.80 is digestion, not reversal.
④ RSI

RSI(14) reads 78.5 — decisively overbought and the highest reading of the entire two-year window. Throughout the 90-day uptrend RSI oscillated between the mid-50s and low 70s, resetting on each shallow pullback, so the current print is a clear departure from the established rhythm. No divergence was flagged in the data — price and momentum made this high together — which means there is no bearish non-confirmation to point to, only extension. It is worth being precise about what overbought means in a trending stock: strong trends can hold RSI above 70 for weeks (band-riding), so 78.5 alone is not a sell signal. What it does say is that the reward-to-risk of a fresh entry at this exact level is poor, because even a routine reset toward 60 typically comes with a price dip toward the first retracement supports. Overbought is a timing caution, not a verdict on the trend.
⑤ Mansfield Relative Strength

Mansfield RS versus the Nasdaq Composite stands at +26.34% with a rising slope — CLBK is not merely keeping pace with the index, it is beating it by a wide and growing margin. The internals show genuine acceleration: a week ago RS was 11.73 and a month ago 6.01, so the weekly change is +14.6 points and the monthly change +20.3 points — positive-zone RS with a strongly positive change on both horizons, the best quadrant this indicator offers. On the two-year chart the RS line spent all of 2024–2025 below zero and only crossed into positive territory in February 2026, coinciding with the price breakout — a classic stage transition. The single caveat is that a large slice of this week's RS jump came from the July 17 spike itself; if that move retraces, RS will give back some of the acceleration. The level, however, would remain firmly positive well before the trend claim is threatened.
⑥ ATR & ADX volatility & trend strength

ADX(14) reads 22.7 — an emerging trend, above the 20 threshold that separates range from trend but not yet past the 25 line that marks an established one. That may seem at odds with a stock up 71% off its low, but the 90-day advance was a low-volatility grind of small daily steps, which keeps ADX subdued; the indicator has been turning up in July and a push through 25 would be the formal confirmation that the steeper leg has legs. ATR(14) is $0.63, or 2.68% of the close — modest daily ranges by small-cap standards, though the ATR expanded sharply on the July 17 bar and will likely stay elevated for a couple of weeks. For risk placement that matters directly: the 1×ATR reference sits at $22.79 and the 2×ATR stop at $22.16, about 5.4% below the close. Note how tight that geometry is after a vertical move — the 2×ATR stop sits between the 38.2% and 50% retracements, so an ordinary fib-band pullback would already press against it.
⑦ OBV on-balance volume

OBV is in accumulation on both timeframes — above a rising 20-day OBV average by +230.88% on the two-year window and +135.10% on the 90-day window. Both readings are inflated by the July 17 volume bar, which by construction added the entire 7.47-million-share session to the cumulative line, but the trend beneath the spike was already constructive: the 90-day OBV line rose steadily above its average from April onward, confirming each price step higher, and no volume divergence appeared at any of the recent highs. Cumulative volume flow, in other words, agrees with price — buyers have absorbed supply throughout the advance rather than distributing into it. The useful forward test is whether OBV holds above its 20-day average once the spike rolls out of the window; a slip below it during a pullback would be the first real evidence that the big bar marked a hand-off rather than fresh demand.
Bull Case vs Bear Case
Bull Case
- Mansfield RS +26.3% vs the Nasdaq Composite and accelerating: +14.6 pts in a week, +20.3 pts in a month.
- Full bullish alignment — Close > SMA5 > SMA20 > SMA60, all rising, with price above both aVWAPs.
- 8.8x average volume on an up-day to the top of the range — the heaviest bar of the two-year chart confirms real demand.
- OBV in accumulation on both windows with no divergence at the highs — volume flow confirms price.
- MACD golden cross (Jun 29) still widening, histogram +0.20 — momentum re-accelerating within an uptrend.
- No unfilled overhead gaps; the only open gap ($17.01–$16.53, Feb 2) sits far below as support.
Bear Case
- RSI 78.5 — the most overbought reading of the two-year window; fresh entries here carry poor reward-to-risk.
- Close above the upper Bollinger Band ($23.02) and ~11% above the SMA20 — statistically stretched.
- The 8.8x volume spike implies an unverified news catalyst — event-driven moves can reverse as fast as they appear.
- Only 2.8% below the 52-week high at $24.09 — nearby resistance where prior sellers sit.
- ADX 22.7 is still only "emerging" — trend strength has not yet confirmed the price move.
- Tight risk geometry: the 2×ATR stop at $22.16 sits inside the ordinary 38.2–50% pullback band — a routine dip can force the exit decision.
Scenarios
| Scenario | Probability | Path | Trigger / Invalidation |
|---|---|---|---|
| Consolidate, then new 52-week high | ~40% | Price digests the spike above the 23.6% retracement at $22.80 for a few sessions, then clears $24.09 on continued above-average volume, extending the stage-2 advance. | Trigger: daily close above $24.09 with volume still above the 20-day average. Invalidation: daily close below $22.41. |
| Fib-band pullback and reset | ~35% | The overbought stretch unwinds into the $22.41–$22.10 retracement band (38.2–50%, with the 90-day aVWAP at $22.38 inside it); RSI resets toward 60 and the trend resumes from a higher base. | Trigger: low-volume drift back under $22.80 that holds the $22.41–$22.10 band on closes. A close below $22.10 shifts odds to the bear case. |
| Spike fades — climactic bar | ~25% | The catalyst disappoints or the burst proves climactic; price closes below the 2×ATR stop at $22.16, then tests the 61.8% level at $21.79 and the July 8 swing low at $20.78. | Trigger: daily close below $22.16 on elevated volume. The swing setup is invalidated below $22.16; below $20.78 the whole July leg is unwound. |
Probabilities are subjective estimates based on the chart evidence above, not forecasts.
Key Levels
| Price | Role | Basis |
|---|---|---|
| $24.09 | Resistance | 52-week high — the last ceiling above the market |
| $23.42 | Current close | July 17, 2026 — 0% anchor of the July 8–17 up-swing |
| $23.02 | Support | Upper Bollinger Band — first reference under the close |
| $22.80 | Support | 23.6% retracement of the July swing; 1×ATR reference $22.79 coincides |
| $22.41 | Support | 38.2% retracement, confluent with the 90-day aVWAP at $22.38 |
| $22.16 | Stop-loss reference | 2×ATR stop — objective invalidation of the swing setup (-5.4% from close) |
| $20.78 | Support | July 8 swing low — 100% retracement; SMA60 rising toward it at $20.17 |
What to Watch
- The catalyst behind the July 17 volume spike — identify the news before treating the technical breakout as durable.
- Volume follow-through: continued above-average volume on strength validates the move; an instant fade back below the ~848K 20-day average flags a one-off event.
- Whether pullback closes hold the $22.80 → $22.41 retracement ladder — the 38.2% level doubles as the 90-day aVWAP test.
- ADX pushing through 25 would upgrade the trend from emerging to established; a rollover back under 20 would not.
- OBV versus its 20-day average once the spike ages out of the window — accumulation is the backbone of the bull case.
Conclusion
Past Analyses of This Stock same ticker · newest first
This analysis is an educational interpretation of chart data and is not investment advice. Probabilities and levels are subjective estimates; every investment decision, and its outcome, is your own responsibility. Columbia Financial is a savings-and-loan holding company — earnings, credit, rate and corporate-action news can move the stock far beyond any technical level. If a stock has just made an outsized news-driven move, technical signals alone are not a sufficient basis to act — check the fundamental catalyst first.
Two Week Swing · twoweekswing.com · 4,600+ stocks screened weekly