Castle Biosciences, Inc.
$28.00 −36.8% from 52-week high ($44.28)
This analysis is based on closing-price data as of July 31, 2026. Whether you're researching how to buy Castle Biosciences, Inc. stock or you've just opened a brokerage account and are trying to time an entry, here are objective support levels and stop-loss references built from the RSI, MACD and ATR indicators.
Castle Biosciences has spent the past year in two violent halves: a run from the $14.59 low of August 2025 to a $44.28 high in February 2026, then a slide that ended near $18 in May and three months of base-building in the low $20s. That base just broke. Friday's close of $28.00 came on 4.38x average volume, above the upper Bollinger Band and back above the two-year anchored VWAP at $27.26 that had capped every rally attempt since the spring breakdown. This page reads the chart through two lenses at once — a properly confirmed base breakout, and a one-session thrust whose cause is not visible anywhere in this data.
Snapshot all values from the July 31, 2026 close
| Item | Value | Read |
|---|---|---|
| Close | $28.00 | Above every moving average and above the upper band |
| 52-week high / low | $44.28 / $14.59 | −36.8% from the high · +91.9% off the low |
| SMA 5 / 20 / 60 | $25.52 / $24.47 / $22.16 | Full bullish stack, and price is well clear of all three |
| Bollinger Bands (20) | $26.80 / $24.47 / $22.14 | Close is outside the upper band; width 19.06% |
| aVWAP 90d (May 7, 2026) | $22.15 | Every buyer since the May low is in profit |
| aVWAP 2y (Aug 5, 2025) | $27.26 | Reclaimed on the breakout bar — first support beneath price |
| RSI (14) | 71.4 (2y) / 71.4 (90d) | Just tipped into overbought; no divergence flagged |
| Mansfield RS vs the Nasdaq Composite | −5.55% | Still underperforming, but rising fast (prior week −15.04, prior month −19.64) |
| MACD (12,26,9) | 0.915 / signal 0.688 / hist +0.227 | Golden cross dated July 30, above the zero line |
| ADX (14) | 30.1 (2y) / 30.4 (90d) | Strong directional reading — strength, not direction |
| ATR (14) | $1.398 (4.99% of price) | High volatility — size positions accordingly |
| OBV (90d / 2y) | Accumulation (rising) / Early accumulation (flat) | Above MA20 on both; +141.78% vs MA20 on 90d, +29.33% on 2y |
| Volume vs 20-day avg | 1,757,800 vs 401,155 (4.38x) | Heavy participation — but a thin 401k-share baseline |
| 1x / 2x ATR stop | $26.60 / $25.21 | 2x ATR stop sits about −10.0% below the close |
① Price & Moving Averages
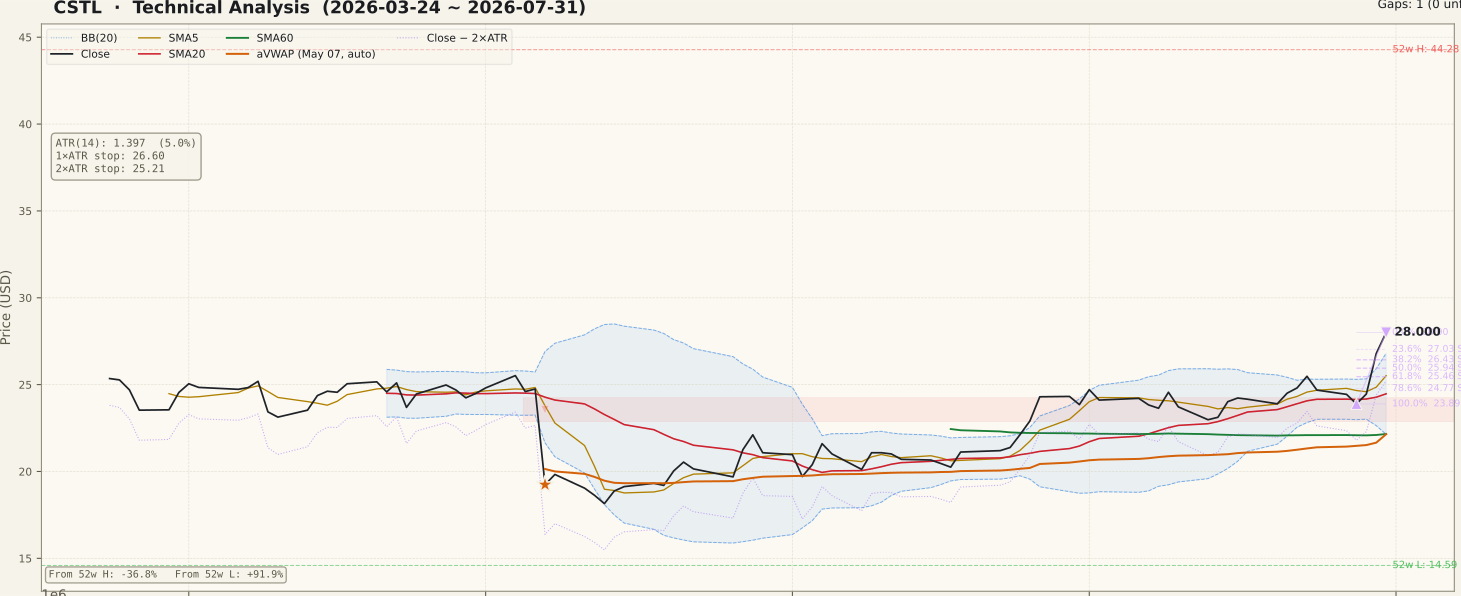
The two-year panel shows a full boom-and-bust cycle: a base near the $14.59 low in the summer of 2025, a near-vertical advance into the $44.28 February 2026 high, and then an equally steep unwind through the spring. What the last 90 days add is repair work — a May low around $18, a slow climb, and a quiet $23.89–$25.50 range through July with the 5-, 20- and 60-day averages braiding together. Friday broke that range: the close at $28.00 sits above SMA5 $25.52, SMA20 $24.47 and SMA60 $22.16 in a clean bullish stack, and above the upper Bollinger Band at $26.80 — strong, but statistically stretched, and closes outside the band usually get retested from above. The two-year Fibonacci grid measures the May down swing ($25.52 on May 4 to $18.15 on May 13); price has now retraced 100% of it and closed above the swing origin, which turns that $25.52 shelf from resistance into the first structural floor. The single unfilled gap on the two-year chart ($15.41–$18.68, August 5, 2025) sits far below and is distant support, not overhead supply; the real overhead is the untraded air left by February's decline, all the way up to $44.28.
② Volume

Friday traded 1,757,800 shares against a 20-day average of 401,155 — a 4.38x ratio and the largest bar of the 90-day window. This is the strongest single argument in the stock's favour: the classic beginner's trap is a breakout on thin volume, and this is the opposite case. Two cautions belong beside it. First, a 4.4x expansion compressed into one session, lifting price clean through a three-month ceiling, is the signature of a news event rather than of patient accumulation — and nothing in this chart data identifies what that event was. Price and volume can tell you participation was heavy; they cannot tell you whether the market priced the news correctly, or whether it will be reassessed next week. Second, the 401,155-share baseline is modest, so spreads can be wide and a single large order can move this stock — expect slippage against any level quoted here.
③ MACD

MACD reads 0.915 against a signal line of 0.688, with the histogram at +0.227 and a golden cross dated July 30 — one session before the breakout bar. Because the cross sits well above the zero line, it carries a continuation flavour rather than the deep-value early turn you get when MACD crosses far below zero. The honest caveat is visible on the 90-day panel: MACD and its signal have converged and crossed repeatedly in both directions through the second half of July while price went nowhere, which is exactly the whipsaw behaviour the indicator produces inside a range. Treat the cross as agreement with what price did, not as independent evidence. What would upgrade it is the histogram staying positive through the coming week while price digests the gain.
④ RSI

RSI prints 71.4 on both timeframes, crossing the 70 line in a single session from the low 50s. No divergence is flagged in the data on either timeframe, so there is no bearish non-confirmation to report — momentum and price moved together. Two readings sit side by side here. In a genuine breakout from a long base, RSI pushing into the 70s is normal and can stay embedded there for weeks; a high RSI on its own is not a signal to sell. But for anyone weighing a new entry at $28.00, an RSI that reached 71 in one day means the entire re-rating happened in that day — the reward-to-risk of buying here is materially worse than it was anywhere in the $23.89–$25.50 range that preceded it.
⑤ Mansfield Relative Strength

Mansfield RS vs the Nasdaq Composite reads −5.55% — still below zero, still underperforming the index, but rising steeply. A week ago it was −15.04 and a month ago −19.64, so the improvement is roughly +9.5 points in a week and +14.1 points in a month. This is the negative-but-improving quadrant, and the distinction matters: the stock is climbing out of deep relative weakness, not leading the market. The two-year panel puts that in context — RS was strongly positive through the winter advance, collapsed to the −40s during the spring decline, and has been repairing since. A cross above zero would be the confirmation that this week's move is a change of regime rather than a bounce inside one; until then, deeply negative RS is a standing warning even when every other panel looks constructive.
⑥ ATR & ADX

ATR sits at $1.398, or 4.99% of price per day, and the 90-day panel shows it spiking vertically on the breakout bar after a long drift lower through the range. That is a volatility regime change, and it argues for smaller position sizes than a quiet stock of the same price would need. ADX reads 30.1 on the two-year view and 30.4 on the 90-day view — a strong reading, but remember ADX measures the strength of a directional move, not its direction; this same gauge was elevated during the spring decline. The practical output is the stop framework: 1x ATR sits at $26.60 and 2x ATR at $25.21, the latter about 10% below the close. Anyone sizing a position off a tighter stop than that is fighting a stock that routinely moves 5% in a session.
⑦ OBV (On-Balance Volume)

The two timeframes tag OBV differently and both readings are worth stating. On the 90-day view OBV is tagged accumulation: 4,118,000 against an MA20 of 1,703,200, a +141.78% positive divergence with a rising slope. On the two-year view it is early accumulation: 10,649,400 versus an MA20 of 8,234,600, a +29.33% divergence, but with a flat slope. In plain terms, short-term money flow is strongly positive while the longer ledger has only stabilised. Note also that the 90-day figure is dominated by the one 4.4x session, so the divergence percentage flatters the picture; a second and third accumulation day at normal volume would mean far more than that headline number does.
Bull Case vs Bear Case
Bull Case
- Three-month base resolved higher on 4.38x average volume — participation, not a thin drift.
- Full bullish stack: close $28.00 above SMA5 $25.52, SMA20 $24.47, SMA60 $22.16.
- Reclaimed the two-year aVWAP at $27.26, the level that capped every rally since the spring breakdown.
- The entire May down swing ($25.52 → $18.15) is 100% retraced and exceeded.
- Mansfield RS repairing fast: −19.64 a month ago → −15.04 a week ago → −5.55.
- MACD golden cross (July 30) above zero with histogram +0.227, and OBV above MA20 on both timeframes.
Bear Case
- A one-session thrust on 4.4x volume has the shape of a news event, and this data set does not identify the catalyst.
- Close sits outside the upper Bollinger Band ($26.80) with band width already 19.06% — stretched.
- RSI 71.4 reached overbought in a single day, right at the top of the move.
- Mansfield RS is still −5.55% — a recovering laggard versus the Nasdaq Composite, not a leader.
- Price is −36.8% below the $44.28 52-week high; February's decline left heavy overhead supply.
- Thin liquidity (20-day average 401,155 shares) plus ATR at 4.99% of price forces a wide $25.21 stop.
Scenarios
| Scenario | Probability | Path | Trigger / Invalidation |
|---|---|---|---|
| Breakout holds — base extends into open ground | ~40% | Price digests above the reclaimed aVWAP ($27.26) and the shallow retracement zone ($27.03–$26.43), volume cools without heavy selling, and the February air pocket above leaves little near-term resistance. | Trigger: pullbacks hold above $26.43 on contracting volume, with Mansfield RS pushing toward zero. Invalidation: a daily close below $25.21. |
| Retracement back into the old range | ~40% | The thrust proves to be a single-day repricing; profit-taking pulls price back inside the band toward $25.94 (50%) and the $25.52 shelf where SMA5 and the May swing origin coincide, offering a second, better-priced decision point. | Trigger: a red close on above-average volume back inside the Bollinger Band. Invalidation of the pullback idea: failure to stabilise above $25.21. |
| Failed breakout — full round trip | ~20% | The unidentified catalyst is faded on second reading; price loses $25.21, then the $24.47 SMA20 and the $23.89 swing low, returning the stock to the July range or below. | Trigger: close below $25.21, especially on renewed high volume. A close below $23.89 would negate the breakout structure entirely. |
Key Levels
| Price | Role | Basis |
|---|---|---|
| $28.00 | Current close | 0% of the swing ($23.89 → $28.00) — Friday, July 31 close |
| $27.26 | Support | Two-year aVWAP (anchor August 5, 2025) — reclaimed on the breakout bar |
| $27.03 | Support | 23.6% retracement of the up swing — shallowest hold |
| $26.80 | Pivot | Upper Bollinger Band (20) — price closed outside it |
| $25.94 | Support | 50% retracement of the up swing |
| $25.52 | Support | SMA5, coinciding with the May 4 swing origin ($25.52) — former range ceiling |
| $25.21 | Stop-loss | 2x ATR stop (about −10.0% from close) — objective invalidation |
What to Watch
- The catalyst itself. A one-session move of this size on 4.4x volume almost always has news behind it, and the chart data contains no information about what it was. Establish that first — technicals alone cannot assess an event-driven move.
- Follow-through volume. Constructive: quiet, shrinking-volume pullbacks that hold $26.43–$27.03. Destructive: another 3–4x volume session that closes red.
- Mansfield RS crossing zero. Above zero would mark a genuine change of leadership versus the Nasdaq Composite; a rollback toward −15 would say the pop was a one-off.
- Behaviour at the Bollinger Band. Closing back inside the band with SMA5 rolling over is the classic tell that an outside-band close was exhaustion rather than initiation.
- The two-year OBV slope. It is flat today; turning up would mean longer-horizon money is following the short-term surge instead of selling into it.
Conclusion
Past Analyses of This Stock same ticker · newest first
This analysis is an educational interpretation of chart data and is not investment advice. Probabilities and levels are subjective estimates; every investment decision, and its outcome, is your own responsibility. This stock just experienced an unusually large, high-volume single-session price move whose cause is not identifiable from the chart data — technical signals alone are not a sufficient basis to buy a stock that may be undergoing a fundamental shock. Data as of the July 31, 2026 close.
Two Week Swing · twoweekswing.com · 4,600+ stocks screened weekly