Calumet, Inc.
$42.83 −0.3% from 52-week high
This analysis is based on closing-price data as of July 17, 2026. Whether you're researching how to buy Calumet, Inc. stock or you've just opened a brokerage account and are trying to time an entry, here are objective support levels and stop-loss references built from the RSI, MACD and ATR indicators.
Calumet has staged one of the stronger two-year turnarounds on the Nasdaq: after basing near $12.94 last year, the stock now sits at $42.83, just 0.3% below its 52-week high of $42.95 and up 231.0% from the 52-week low. The July leg is a textbook momentum breakout — a fresh MACD golden cross (June 29), Mansfield RS accelerating to +60.4% vs the Nasdaq Composite, and Friday's close arriving on 2.5× average volume. The caveat is just as visible: RSI has stretched to 83.4, the close is pressed against the upper Bollinger band, and the nearest Fibonacci support sits more than two dollars below — so the lens here is a strong trend that has earned respect but a poor risk/reward point for fresh chasing.
Snapshot all values from the July 17, 2026 chart data
| Metric | Value | Reading |
|---|---|---|
| Close | $42.83 | −0.3% from 52w high, +231.0% from 52w low |
| 52-week range | $12.94 – $42.95 | Pressing the top of the range |
| SMA 5 / 20 / 60 | $40.61 / $36.99 / $34.72 | Bullish stack: Close > 5 > 20 > 60 |
| Bollinger (20) | $31.03 / $36.99 / $42.96 | Close at the upper band; width 32.25% (expanded) |
| aVWAP (2y anchor Apr 9, 2025) | $22.95 | Long-term holders deep in profit |
| aVWAP (90d anchor May 8, 2026) | $35.61 | Recent buyers also in profit |
| RSI (14) | 83.4 | Deeply overbought; no divergence detected |
| Mansfield RS (vs the Nasdaq Composite) | +60.4% | Outperforming, rising (prior week +45.6, prior month +27.8) |
| MACD (12,26,9) | 1.86 / 1.33 / +0.53 | Golden cross June 29, 2026; histogram widening |
| ADX (14) | 31.4 | Strong trend (>25) |
| ATR (14) | $1.56 (3.64% of price) | Moderate daily swing budget |
| OBV (2y / 90d) | Accumulation / Accumulation | Above rising MA20 in both frames (+32.39% / +97.20% vs MA) |
| Volume (last vs 20-day avg) | 2,742,800 vs 1,114,350 | 2.46× average — the breakout is confirmed by volume |
| Stop references | 1×ATR $41.27 / 2×ATR $39.71 | Objective invalidation levels from Friday's close |
① Price & Moving Averages
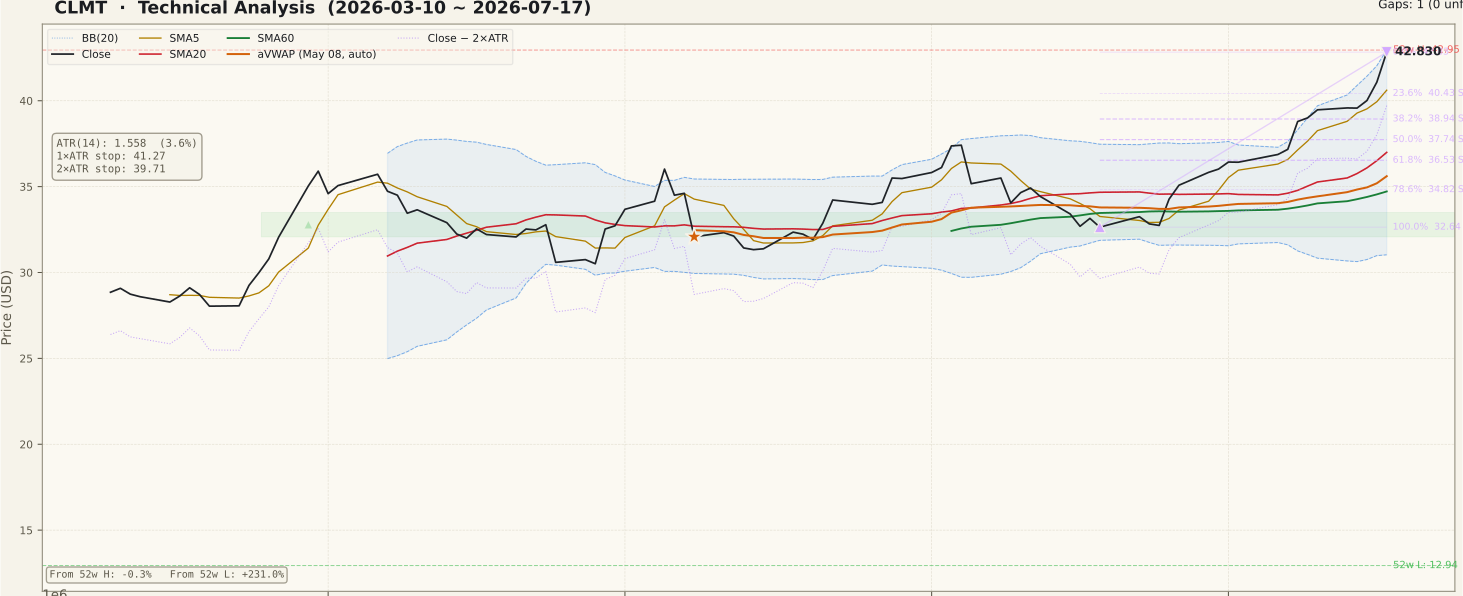
The two-year chart shows a completed round trip and recovery: a 2024 top near $22, a slide to roughly $9–10 by spring 2025, then a persistent advance that went near-vertical from February 2026 onward. The 90-day window picks up the latest chapter — a two-month consolidation in the $31–$36 zone through May and June, resolved by a July ramp that has walked up the upper Bollinger band into Friday's $42.83 close, a whisker under the $42.95 52-week high. The moving averages are in full bullish alignment (Close > SMA5 $40.61 > SMA20 $36.99 > SMA60 $34.72), and both anchored VWAPs — $22.95 from the April 2025 low anchor and $35.61 from the May 8, 2026 anchor — sit well below price, meaning both long-term and recent buyers are carrying profits and near-term supply pressure from trapped holders is limited. The flip side of a band-walk this steep is that the nearest structural support is not close: the 23.6% retracement of the June 18 → July 17 swing sits at $40.43, and the swing origin is all the way down at $32.64. Notably, there are no unfilled gaps on the two-year chart, so there is no gap magnet hanging below price — but also no gap support to lean on.
② Volume

Friday printed 2,742,800 shares against a 20-day average of 1,114,350 — a 2.46× expansion on a session that closed at the top of the yearly range. That matters because the classic trap for newer chart readers is a breakout on thin volume; this is the opposite case, with participation expanding exactly where you want to see it. The 90-day panel also shows volume spikes clustered on up days in July, consistent with the accumulation reading on OBV below. One honest caution: a 2.5× volume day at a 52-week high can mark enthusiasm as easily as initiative buying, and a single session is not a trend — the follow-through days matter more than the spike itself.
③ MACD

MACD (1.86) sits above its signal line (1.33) with a positive and widening histogram (+0.53) following the golden cross on June 29, 2026. The cross fired from just above the zero line rather than from deeply negative territory, which frames it as a trend-continuation signal — the June pullback reset momentum without breaking the structure, and the current thrust is the strongest of the 90-day window. Momentum is unambiguously with the bulls here; the thing to monitor is the histogram, because after a run this steep the first shrinking histogram bar is often the earliest, cheapest warning that the leg is tiring, well before any support level is tested.
④ RSI

RSI stands at 83.4 — far above the 70 overbought threshold and the highest reading of the 90-day window, exceeding even the late-March spike that preceded a multi-week consolidation. Two things can be true at once: extreme RSI readings occur most often in the strongest trends (overbought can stay overbought), and buying at RSI 83 statistically front-loads risk, because even routine mean reversion from such levels typically retraces to the mid-band. No divergence is detected in the data — price highs and RSI highs are still confirming each other — so this is stretch, not (yet) deterioration. The constructive pattern from here would be a pullback in which RSI cools toward 50 while price holds above the first retracement supports; that is how strong trends typically refuel.
⑤ Mansfield Relative Strength

Mansfield RS vs the Nasdaq Composite reads +60.4% — deep in outperformance territory with a rising slope. The acceleration profile is what stands out: a week ago the reading was +45.6 (a gain of +14.7 points on the week) and a month ago it was +27.8 (a gain of +32.6 points on the month). Positive and accelerating is the strongest quadrant this indicator offers — CLMT is not merely beating its benchmark, the margin of outperformance is widening. On the two-year panel, RS crossed above zero around late 2025 and has stayed positive since, meaning the entire 2026 advance has been leadership, not just beta. Relative strength this persistent is the main argument for treating pullbacks as opportunities rather than exits — while it lasts.
⑥ ATR & ADX

ATR(14) is $1.56, or 3.64% of price — a meaningful but not extreme daily swing budget, and one that has been creeping higher through July as the advance steepened. ADX(14) at 31.4 is above the 25 threshold and rising, confirming that this is a strong, directional trend rather than chop; recall that ADX measures trend strength, not direction, but here it aligns with an uptrend. Practically, the ATR converts into the two objective stop references on this page: $41.27 (1×ATR below Friday's close) for tight tactical management, and $39.71 (2×ATR) as the structural invalidation that gives the position room for normal noise. Position sizing should assume roughly $1.50–$1.70 of daily movement in either direction.
⑦ OBV (On-Balance Volume)

OBV reads accumulation on both timeframes — above a rising 20-day average in each — which is the cleanest confirmation volume can give a breakout. On the two-year panel OBV sits 32.39% above its average, having climbed steadily since the early-2026 lows; on the 90-day panel the gap is a striking +97.20%, reflecting how one-sided July's volume flow has been. There is no negative divergence here: OBV is making new highs alongside price, so the advance is being paid for with real volume rather than drifting up on air. If price were to push to a marginal new high while OBV flattened below these levels, that non-confirmation would be an early distribution warning — it is the specific failure mode to watch for after a 2.5× volume climax day.
Bull Case vs Bear Case
Bull Case
- Full bullish MA alignment (Close > SMA5 > SMA20 > SMA60) with price 0.3% from a 52-week high — trend, structure and momentum all point the same way.
- Friday's push came on 2.46× average volume — a volume-confirmed breakout, not a thin drift.
- Mansfield RS +60.4% vs the Nasdaq Composite and accelerating (+14.7 pts week-over-week, +32.6 pts month-over-month) — widening leadership.
- MACD golden cross (June 29) with a widening histogram; ADX 31.4 confirms a strong directional trend.
- OBV in accumulation on both the 2-year and 90-day frames, making new highs with price — no volume divergence.
- Both anchored VWAPs ($22.95 long-term, $35.61 short-term) sit far below price — holders are in profit, limiting overhead supply.
Bear Case
- RSI 83.4 is deeply overbought — the highest of the 90-day window — and entries at such readings historically carry poor short-term risk/reward.
- The close is pinned to the upper Bollinger band ($42.96) with band width expanded to 32.25% — a stretched, high-volatility state.
- The July leg was near-vertical: the nearest Fibonacci support ($40.43) is 2.4 ATRs of structure below, leaving thin footing for late buyers.
- The 52-week high at $42.95 has not actually been cleared on a closing basis — this is still an approach, not a confirmed breakout to new highs.
- A 2.5× volume surge at a range top can mark a short-term buying climax; follow-through is unproven.
- After a +231% year, profit-taking incentive is large, and a routine reversion to the 20-day SMA ($36.99) would be a −13%-class drawdown from the close.
Scenarios
| Scenario | Probability | Path | Trigger / Invalidation |
|---|---|---|---|
| Consolidate high, then break to new 52-week highs | ~45% | Price digests the July run above the 23.6% retracement ($40.43), RSI cools without structural damage, then clears $42.95 on above-average volume and enters price discovery. | Trigger: daily close above $42.95 with volume > 20-day average. Invalidation: daily close below $39.71 (2×ATR stop). |
| Overbought pullback into the retracement zone | ~40% | Rejection near $42.95; price retraces into the 38.2%–50% zone ($38.94–$37.74), toward the rising SMA20 ($36.99), while RSI resets toward 50 — trend intact, timing improved. | Trigger: close below $40.43 after a failed push at the high. Trend remains constructive while closes hold above $36.53 (61.8%). |
| Deeper correction of the June–July swing | ~15% | Momentum unwind accelerates; closes below the 2×ATR stop and then the 61.8% level open a path to $34.82 (78.6%) and the $32.64 swing origin, near the rising SMA60 ($34.72). | Trigger: daily close below $39.71 followed by a close below $36.53. Re-evaluate the whole setup if $32.64 fails. |
Key Levels
| Price | Role | Basis |
|---|---|---|
| $42.95 | Resistance | 52-week high; upper Bollinger band ($42.96) — the line the breakout must clear on a close |
| $42.83 | Current close | 0% of the June 18 → July 17 up-swing (swing end) |
| $41.27 | Support | 1×ATR stop reference — tight tactical trailing level |
| $40.43 | Support | 23.6% retracement of the up-swing — first structural support |
| $39.71 | Stop-loss (2×ATR) | Objective invalidation of the breakout setup — a daily close below ends the trade thesis |
| $38.94 | Support | 38.2% retracement — top of the healthy-pullback landing zone |
| $36.99 | Support | SMA20 / Bollinger mid-band, just above the 61.8% retracement ($36.53) |
What to Watch
- The $42.95 close. A daily close above the 52-week high on above-average volume converts the approach into a confirmed breakout; repeated intraday failures there raise double-top risk.
- Volume on the next 3–5 sessions. Constructive: quiet, low-volume drift or a shallow pullback. Concerning: another huge-volume day that closes weak (potential climax).
- Behavior at $40.43. The first test of the 23.6% retracement tells you whether dip buyers are still in control; a clean hold there is the pattern's best add/entry signal.
- OBV vs its 20-day average. OBV slipping below its rising MA20 during a pullback would be the first real crack in the accumulation story.
- Mansfield RS staying above +45.6. Holding above last week's reading keeps the "positive and accelerating" leadership profile intact; a roll-over below it would mark the first deceleration of this leg.
Conclusion
Past Analyses of This Stock same ticker · newest first
This analysis is an educational interpretation of chart data and is not investment advice. Probabilities and levels are subjective estimates; every investment decision, and its outcome, is your own responsibility. Technical signals alone are not a sufficient basis for buying any stock — always check position sizing and your own risk tolerance first.
Two Week Swing · twoweekswing.com · 4,600+ stocks screened weekly