Best Buy Co., Inc.
$82.80 −2.58% from 52-week high
This analysis is based on closing-price data as of July 10, 2026. Whether you're researching how to buy Best Buy stock or you've just opened a brokerage account and are trying to time an entry, here are objective support levels and stop-loss references built from the RSI, MACD and ATR indicators.
Best Buy has staged a powerful two-month recovery: from the May 13 swing low at $55.52 the stock gapped higher in late May and has climbed to $82.80, just 2.58% below its 52-week high of $84.99, with all three moving averages stacked bullishly beneath price. Relative strength versus the S&P 500 turned decisively positive (+6.23 and accelerating), and MACD printed a fresh golden cross on July 10. The caveats are real, though: the stock is pushing into an old unfilled resistance gap ($80.13–$86.46), volume is running below average, and RSI shows a bearish divergence — so this reads as a strong trend that has not yet confirmed its latest breakout.
Snapshot July 10, 2026 close · from chart JSON
| Close | $82.80 |
|---|---|
| 52-week high / low | $84.99 (−2.58%) / $55.10 (+50.27%) |
| SMA 5 / 20 / 60 | $79.52 / $77.31 / $68.33 — bullish stack, price above all three |
| Bollinger Bands (20) | $73.24 – $77.31 – $81.38 · width 10.53% — close sits above the upper band |
| Anchored VWAP (90d) | $75.62 (anchor May 28, 2026) — price above |
| Anchored VWAP (2y) | $69.75 (anchor Mar 4, 2025) — price above |
| RSI (14) | 70.49 — overbought zone, bearish divergence flagged |
| Mansfield RS (vs the S&P 500) | +6.23, outperform, rising (prev week +1.11 · prev month +0.29) |
| MACD (12,26,9) | 2.68 vs signal 2.65, histogram +0.03 — golden cross on Jul 10, 2026 |
| ADX (14) | 27.66 — strong trend |
| ATR (14) | $2.49 (3.00% of price) |
| OBV | 2y: early accumulation, above MA20, flat slope (+21.16%) · 90d: early accumulation, above MA20, flat slope (+54.32%) |
| Volume vs 20-day avg | 0.94× (3,588,934 vs 3,831,547) — below average |
| ATR stops | 1× $80.31 · 2× $77.83 (−6.0% from close) |
① Price & Moving Averages
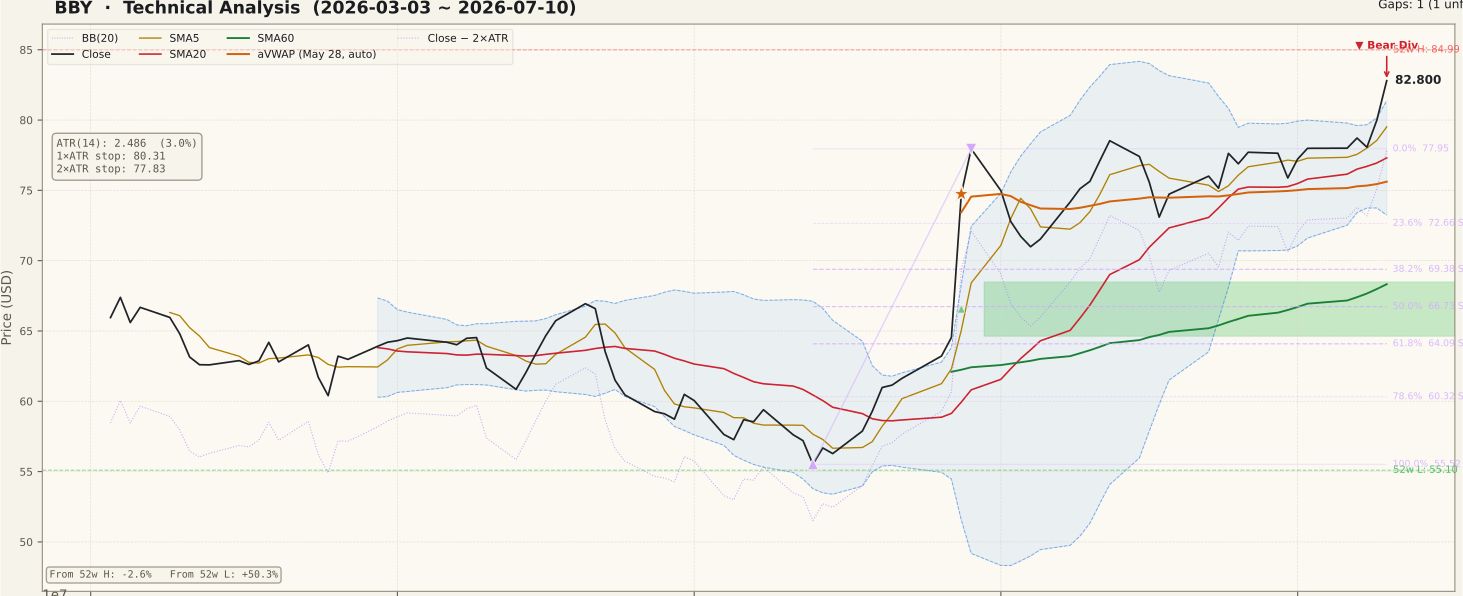
On the two-year chart, Best Buy spent most of the period repairing damage from the 2024–2025 downtrend, then reversed sharply off the May 13, 2026 low at $55.52. The recovery has been unusually steep: a large upside gap on May 28 ($64.63–$68.49, still unfilled and now acting as support) launched the current leg, and price has since climbed in stair-steps to $82.80. The moving averages are in full bullish alignment — close above the 5-day ($79.52), 20-day ($77.31) and 60-day ($68.33) — and the Friday close finished above the upper Bollinger Band ($81.38), which signals strong momentum but also a short-term stretched condition. Two features overhead deserve respect: price is currently trading inside the unfilled March 4, 2025 gap ($80.13–$86.46), and a second unfilled gap sits at $88.90–$91.97 from November 2024. Gaps like these often supply resistance until they are convincingly filled on volume.
② Volume

The latest session traded 3,588,934 shares against a 20-day average of 3,831,547 — a ratio of 0.94, below average. That matters because price is simultaneously pressing to new swing highs near the 52-week high: a breakout attempt on below-average volume is the classic pattern beginners get trapped by, since it suggests the move is being driven more by an absence of sellers than by aggressive new buying. This is not disqualifying — low-volume drift higher can persist in strong trends — but a decisive move through $84.99 should come with volume expanding back above 1× the average to be trusted.
③ MACD

MACD printed a fresh golden cross on July 10, 2026, with the MACD line at 2.68 edging above the signal at 2.65 and the histogram turning barely positive (+0.03). Two nuances: first, the cross occurred well above the zero line, which means it is a momentum re-acceleration signal inside an established uptrend rather than an early-stage reversal; second, it is only one day old and the histogram is razor-thin, so it can flip back with a single weak session. Watch whether the histogram widens over the coming days — a series of growing positive bars would confirm the cross, while an immediate re-flip would validate the caution coming from RSI.
④ RSI

RSI stands at 70.49, right at the conventional overbought threshold, and the chart flags a bearish divergence: on May 29, 2026 price peaked at $77.95 with RSI at 82.02, while the new price high of $82.80 on July 10 came with RSI at only 70.49. Price made a higher high; momentum made a lower high. That is a caution flag, not a sell signal — divergences in strong uptrends can persist for weeks and resolve through sideways time rather than a decline. It becomes actionable only with confirmation, such as a close back below the prior breakout area near $77.95 or a MACD histogram rollover. Until then, treat it as a reason to demand volume confirmation before chasing.
⑤ Mansfield Relative Strength

Mansfield RS versus the S&P 500 reads +6.23 — comfortably above the zero line, in outperform territory, with a rising slope. The acceleration is the standout: a week ago RS was +1.11 (a gain of +5.12 points week over week) and a month ago just +0.29 (+5.93 points month over month). In other words, Best Buy has gone from roughly market-neutral to a clear market leader in about four weeks, and the improvement is speeding up rather than fading. Positive and accelerating RS is the strongest single item in this stock's bull case, because swing setups that outperform their benchmark tend to attract systematic and momentum buyers on pullbacks.
⑥ ATR & ADX

ATR is $2.49, or 3.00% of price — a moderate daily range that makes position sizing straightforward. ADX at 27.66 is above the 25 threshold, classifying this as a strong trend; remember ADX measures trend strength, not direction, but here the direction is clearly up. For risk management the JSON provides two objective stops: a tight 1×ATR stop at $80.31 and a standard 2×ATR stop at $77.83, about 6.0% below the close. Notably, the 2×ATR stop sits just below the prior swing high at $77.95 — the level a healthy breakout should not revisit on a closing basis — so the volatility stop and the structural stop happen to agree, which makes $77.83 a clean line in the sand.
⑦ OBV

On-balance volume tells a consistent story on both timeframes: early accumulation, with OBV above its 20-day average on the 2-year view (+21.16% divergence) and more strongly on the 90-day view (+54.32%). The slope, however, is flat on both — cumulative volume is holding its gains rather than actively expanding. Read together with the sub-average session volume, this says the big money that drove the May–June advance has not left, but it also is not visibly adding at these prices. A turn higher in OBV slope alongside a volume pickup would be the confirmation this breakout currently lacks; OBV rolling below its MA20 would be the early warning.
Bull Case vs Bear Case
Bull Case
- Full bullish moving-average stack: close $82.80 above SMA5 $79.52 > SMA20 $77.31 > SMA60 $68.33.
- Mansfield RS +6.23 vs the S&P 500 and accelerating hard (+5.12 pts in a week, +5.93 in a month).
- Fresh MACD golden cross (Jul 10) with both lines well above zero — momentum re-accelerating inside an uptrend.
- ADX 27.66 confirms a strong, established trend; +50.27% off the 52-week low.
- OBV above its 20-day average on both timeframes (early accumulation; 90d divergence +54.32%).
- Price above both anchored VWAPs ($75.62 / $69.75) and the May 28 gap ($64.63–$68.49) stands as deep support.
Bear Case
- Bearish RSI divergence: price higher high $77.95 → $82.80 while RSI fell 82.02 → 70.49.
- Breakout volume only 0.94× the 20-day average — the push toward the 52-week high is unconfirmed.
- Price is trading inside the unfilled Mar 4, 2025 resistance gap ($80.13–$86.46), with more supply at $88.90–$91.97.
- RSI 70.49 is in the overbought zone at the same time the divergence is flagged.
- Close finished above the upper Bollinger Band ($81.38) — short-term stretched, mean-reversion risk toward $77.31.
- Only 2.58% of headroom to the 52-week high ($84.99) versus a 6.0% distance to the 2×ATR stop — thin near-term reward-to-risk without a pullback.
Scenarios
| Scenario | Probability | Path | Trigger / Invalidation |
|---|---|---|---|
| Confirmed breakout continuation | ~40% | Clears the 52-week high $84.99 and works through the gap toward $86.46, then the $88.90–$91.97 gap zone. | Trigger: close above $84.99 with volume >1× average and a widening MACD histogram. Invalidation: close back below $77.95. |
| Pullback and retest | ~40% | Overbought RSI, divergence and soft volume pull price back to the $77.95 breakout shelf / SMA20 $77.31, which holds; the trend then resumes. | Trigger: rejection inside the $80.13–$86.46 gap on continued sub-average volume. Constructive while closes hold above $77.31. |
| Failed breakout | ~20% | Loses the 2×ATR stop $77.83, the divergence confirms, and price retraces toward the 90d anchored VWAP $75.62 and the 23.6% retracement $72.66. | Trigger: daily close below $77.83. Deeper invalidation of the swing thesis below $72.66. |
Key Levels
| Level | Role | Basis |
|---|---|---|
| $88.90 | Resistance | Bottom of unfilled Nov 26, 2024 gap ($88.90–$91.97) |
| $86.46 | Resistance | Top of unfilled Mar 4, 2025 gap — price is trading inside this gap now |
| $84.99 | Resistance | 52-week high |
| $82.80 | Current | July 10, 2026 close |
| $80.31 | Support | 1×ATR stop reference |
| $77.95 | Support | Prior swing high (May 29) — 0% line of the May up swing; breakout shelf |
| $77.83 | Stop-loss | 2×ATR stop (−6.0% from close), just under the $77.95 shelf |
What to Watch
- Volume on strength: any close above $84.99 needs volume back above 1× the 20-day average (>3.83M shares) to trust the breakout.
- The $77.95 shelf: pullbacks that hold the prior swing high on a closing basis keep the structure bullish; a close below $77.83 breaks it.
- MACD histogram: widening positive bars confirm the July 10 golden cross; an immediate flip back negative sides with the RSI divergence.
- OBV slope: a turn from flat to rising would supply the accumulation confirmation the tape currently lacks.
- Behavior inside the gap: how price acts within $80.13–$86.46 — absorption and grind higher is bullish, sharp rejection is not.
Conclusion
Past Analyses of This Stock same ticker · newest first
This analysis is an educational interpretation of chart data and is not investment advice. Probabilities and levels are subjective estimates; every investment decision, and its outcome, is your own responsibility. Technical signals alone are never a sufficient reason to buy a stock that has just moved on a fundamental catalyst — always check the news first.
Two Week Swing · twoweekswing.com · 4,600+ stocks screened weekly