Amplitude, Inc.
$9.18 −36.6% from 52-week high · +66.6% above 52-week low
This analysis is based on closing-price data as of July 10, 2026. Whether you're researching how to buy Amplitude, Inc. stock or you've just opened a brokerage account and are trying to time an entry, here are objective support levels and stop-loss references built from the RSI, MACD and ATR indicators.
Over the past two years AMPL round-tripped from roughly $8 to above $14 and back down to a $5.51 fifty-two-week low, and the dominant long-term trend is still repair work, not an established uptrend. The last three weeks changed the short-term picture: price has climbed from the $6.46 swing low to $9.18, moving averages have flipped into a bullish stack, and a June 29 MACD golden cross is still widening. The catch is directly overhead — the two-year anchored VWAP at $9.38, where the average buyer since the February 2025 peak finally breaks even — and the latest advance came on below-average volume, so this is a recovery rally approaching its first serious supply test rather than a confirmed trend change.
Snapshot all values from chart JSON, July 10, 2026
| Item | Value | Reading |
|---|---|---|
| Close | $9.18 | −36.6% from 52w high, +66.6% above 52w low |
| 52-week high / low | $14.49 / $5.51 | mid-range after a deep drawdown |
| SMA 5 / 20 / 60 | $9.09 / $7.62 / $7.22 | bullish stack, close above all three |
| Bollinger (upper / mid / lower) | $9.78 / $7.62 / $5.47 | width 56.48% — bands wide open |
| aVWAP 90d (anchor May 7, 2026) | $7.24 | price well above — recent buyers in profit |
| aVWAP 2y (anchor Feb 20, 2025) | $9.38 | just overhead — long-term break-even supply |
| RSI(14) | 69.27 | at the edge of the overbought zone |
| Mansfield RS vs the Nasdaq Composite | −13.85% | still underperforming, but rising (prev week −16.72, prev month −36.38) |
| MACD (12,26,9) | 0.58 / 0.37 / +0.21 | golden cross June 29, histogram positive |
| ADX(14) | 29.73 | strong trend strength |
| ATR(14) | $0.57 (6.16%) | high daily volatility — size positions accordingly |
| OBV | 2y: accumulation / 90d: accumulation | above MA20 and rising on both frames |
| Volume vs 20-day avg | 0.66x | latest close on below-average volume |
| ATR stops (1x / 2x) | $8.62 / $8.05 | objective invalidation references |
① Price & Moving Averages
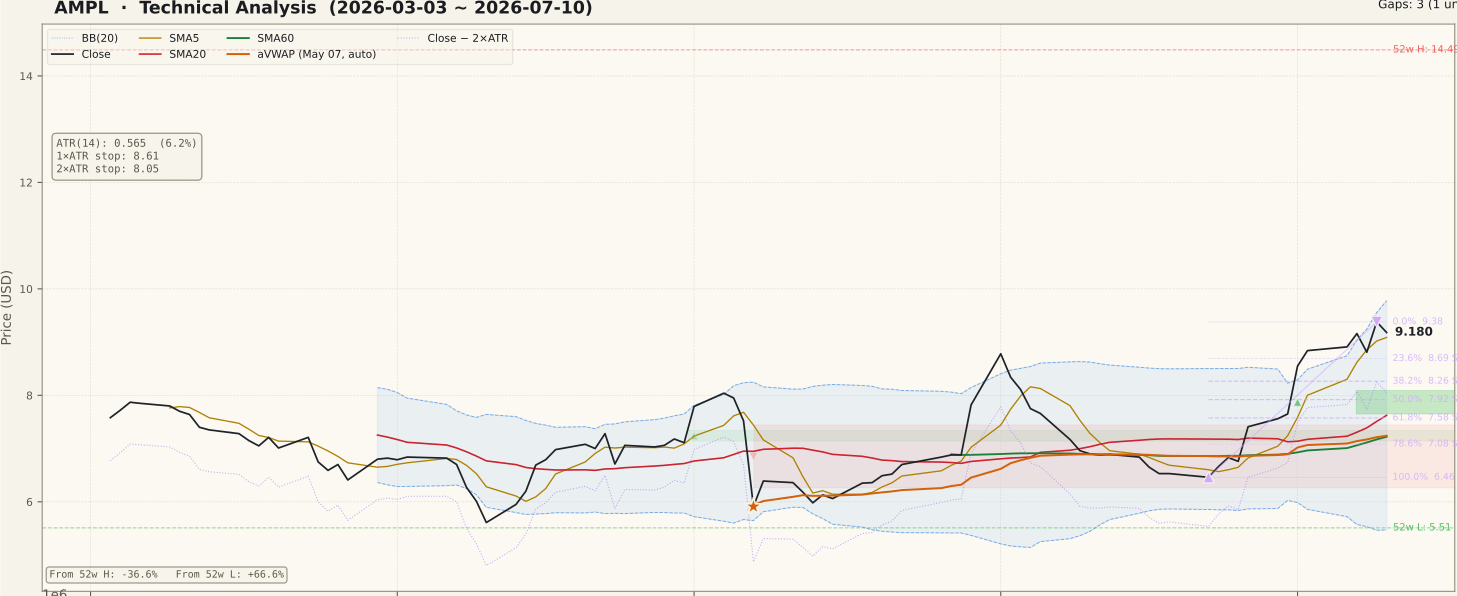
The 90-day chart shows a clean transition from a choppy $6–$8 base into a rising channel: close $9.18 sits above SMA5 ($9.09), SMA20 ($7.62) and SMA60 ($7.22), and the stack is in bullish order with all three sloping up. Price is riding the upper half of a very wide Bollinger envelope (width 56.48%), a band-walking pattern typical of a strong short-term advance. The Fibonacci grid drawn on the June 22 to July 9 up-swing ($6.46 to $9.38) puts first retracement support at $8.69 (23.6%) and $8.26 (38.2%), and an unfilled July 1 gap at $7.65–$8.09 adds a second support shelf below that. Overhead, the two-year anchored VWAP at $9.38 coincides exactly with the swing high — the single most important resistance on this chart. On the two-year frame the picture is humbler: price is still 36.6% below the $14.49 high, so this remains a recovery inside a larger damaged structure.
② Volume

The rally off the late-June low featured several strong green sessions, including a large spike in early July, but the most recent bar printed only 0.66x the 20-day average (1,696,233 shares vs a 2,573,267 average). A common beginner mistake is treating any push to new swing highs as confirmation; an advance into known resistance on fading volume is exactly the setup that stalls. For the move through $9.38 to be trustworthy, volume needs to expand back above its average on the breakout day itself.
③ MACD

MACD (0.58) crossed above its signal line (0.37) on June 29 and the histogram (+0.21) has kept expanding since — a healthy momentum profile with no sign of rollover yet. The cross occurred above the zero line, which usually marks trend continuation rather than a bottom-fishing signal. The practical caveat: MACD is a lagging indicator, and with price already pressed against $9.38 resistance, momentum strength here tells you the engine is running, not that the road ahead is clear.
④ RSI

RSI(14) reads 69.27, right at the 70 overbought threshold after tagging it earlier in July. No divergence is flagged in the data — price highs and RSI highs are still rising together, which is what a sound advance looks like. Overbought in a fresh uptrend is not by itself a sell signal; strong moves can hold RSI above 70 for weeks. It does, however, tell you that chasing here buys into a statistically stretched short-term condition, and a cooling-off dip toward the 50 area would be the more comfortable entry zone this indicator can offer.
⑤ Mansfield Relative Strength

Mansfield RS vs the Nasdaq Composite sits at −13.85% — AMPL is still an underperformer over the measured window — but the direction of travel is the story. A week ago the reading was −16.72 (a +2.87-point improvement) and a month ago −36.38 (+22.53 points), so the stock is closing its performance gap with the index at a fast clip. In Mansfield terms this is "negative but improving": the strongest swing candidates usually cross above the zero line before their biggest moves, so a push into positive territory would be a meaningful upgrade, while a stall below zero would mark this as just another counter-trend bounce.
⑥ ATR & ADX

ADX at 29.73 confirms a strong trend is in force — remember ADX measures strength, not direction, and here it is rising alongside an advancing price, which is the bullish combination. ATR at $0.57 is 6.16% of the share price, roughly triple what large-cap traders are used to: a normal day can move this stock more than 6%. That argues for smaller position sizes and wider stops — the 1x ATR reference sits at $8.62 and the 2x ATR stop at $8.05, about 12.3% below the close. If a 12% stop distance is too wide for your risk budget, the correct fix is a smaller position, not a tighter, noise-prone stop.
⑦ OBV (On-Balance Volume)

OBV is in an accumulation state on both timeframes — above its 20-day average and rising, with the 90-day OBV (1,532,867) sitting far above its average (−12,061,087) and the two-year frame telling the same story. That said, the chart flags a caution marker at the very latest bars, where OBV ticked down from its recent peak even as price held near the swing high. It is too early to call that a confirmed bearish divergence — the accumulation state is intact — but it is worth watching: if price makes a new high above $9.38 and OBV fails to follow, the breakout would lack the buying pressure it needs.
Bull Case vs Bear Case
Bull Case
- Bullish moving-average stack: close $9.18 above SMA5 > SMA20 > SMA60, all rising
- MACD golden cross on June 29 with a still-expanding positive histogram
- OBV in accumulation on both 2y and 90d frames — above MA20 and rising
- Mansfield RS improving fast: +2.87 pts week-over-week, +22.53 pts month-over-month
- ADX 29.73 — the advance qualifies as a strong trend, not drift
- Unfilled July 1 gap at $7.65–$8.09 provides a defined support shelf below
Bear Case
- Relative strength is still negative (−13.85%) — AMPL remains a market underperformer
- Two-year anchored VWAP at $9.38 sits directly overhead — trapped-buyer supply
- Latest close came on 0.66x average volume — weak confirmation into resistance
- RSI 69.27 at the overbought threshold; short-term risk/reward is stretched
- Still 36.6% below the 52-week high — the larger structure is unrepaired
- ATR 6.16% of price and Bollinger width 56.48% — volatility punishes poor timing
Scenarios
| Scenario | Probability | Path | Trigger / Invalidation |
|---|---|---|---|
| Breakout continuation | ~40% | Clears the $9.38 anchored-VWAP / swing-high barrier and extends toward the Bollinger upper band at $9.78, opening room above. | Trigger: daily close above $9.38 on volume back above the 20-day average. Invalidated by a quick slip back below $8.69. |
| Pullback and rebuild | ~35% | Rejected near $9.38, retraces into the $8.69–$8.26 Fibonacci band or the $8.09–$7.65 gap shelf, cools RSI, then retries. | Trigger: stall under $9.38 on weak volume. Constructive while closes hold above $8.05. |
| Failed recovery | ~25% | Supply at $9.38 wins, volume never confirms, and price breaks back through the gap shelf toward the SMA20 zone near $7.62. | Trigger: daily close below the 2x ATR stop at $8.05 — the swing thesis is negated there. |
Key Levels
| Price | Role | Basis |
|---|---|---|
| $9.78 | Resistance | Bollinger upper band |
| $9.38 | Resistance | Two-year anchored VWAP (Feb 20, 2025) + swing high / Fibonacci 0% |
| $9.18 | Current | Close, July 10, 2026 |
| $8.69 | Support | Fibonacci 23.6% retracement of the June–July up-swing |
| $8.26 | Support | Fibonacci 38.2% retracement |
| $8.09–$7.65 | Support | Unfilled July 1 gap zone |
| $8.05 | Stop-loss | 2x ATR below close — objective invalidation |
What to Watch
- A daily close above $9.38 — and whether volume expands above the 20-day average on that day. A low-volume poke above is a trap risk, not a breakout.
- Mansfield RS crossing the zero line: it has improved from −36.38 to −13.85 in a month; turning positive would confirm genuine leadership rather than a bounce.
- OBV behavior on any new price high — a fresh OBV high confirms; a lower OBV high would set up a bearish divergence.
- The $8.69–$8.26 retracement band on any pullback: buyers stepping in there keeps the structure bullish.
- A close below $8.05 (2x ATR stop) — mechanical exit; the recovery thesis fails there.
Conclusion
Past Analyses of This Stock same ticker · newest first
This analysis is an educational interpretation of chart data and is not investment advice. Probabilities and levels are subjective estimates; every investment decision, and its outcome, is your own responsibility. A bottoming signal is not a buy signal. All figures are derived from closing-price data as of July 10, 2026 and may be outdated by the time you read this.
Two Week Swing · twoweekswing.com · 4,600+ stocks screened weekly