Amerant Bancorp Inc.
$28.50 −0.5% vs 52-week high $28.63
This analysis is based on closing-price data as of July 24, 2026. Whether you're researching how to buy Amerant Bancorp Inc. stock or you've just opened a brokerage account and are trying to time an entry, here are objective support levels and stop-loss references built from the RSI, MACD and ATR indicators.
Amerant Bancorp closed Friday at $28.50, just 0.5% under its 52-week high of $28.63 and a full 82.5% above its 52-week low — a two-year base near the $16–$26 area has finally resolved upward. The breakout came with real force: roughly a 12% two-session thrust on 2.5× average volume, a fresh MACD golden cross, and Mansfield RS accelerating to +24.9% versus the S&P 500. The caution is that the move is stretched — price closed above the upper Bollinger Band, RSI sits at 73.7, and the chart engine flags a bearish RSI divergence. The useful lens here is breakout management: strong trend evidence, but entry timing and an objective stop matter more than ever after a vertical bar.
Snapshot as of Jul 24, 2026 close
| Close | $28.50 |
|---|---|
| 52-week range | $15.62 – $28.63 (−0.5% from high · +82.5% above low) |
| SMA 5 / 20 / 60 | $26.29 / $25.82 / $23.95 (bullish stack, price above all three) |
| Bollinger (20, 2σ) | $24.38 / $25.82 / $27.25 · width 11.12% (close above upper band) |
| aVWAP — 90d | $25.92 (anchor Jun 26, 2026 · price above) |
| aVWAP — 2y | $21.21 (anchor Sep 26, 2024 · price above) |
| RSI (14) | 73.7 overbought · bearish divergence flagged |
| Mansfield RS (vs S&P 500) | +24.9% · outperforming, rising (prior week +14.3 · prior month +11.2) |
| MACD (12, 26, 9) | 0.69 vs signal 0.61 · histogram +0.08 · golden cross Jul 24 |
| ADX (14) | 25.3 strong (90d) · 24.8 emerging (2y) |
| ATR (14) | $0.83 (2.91% of price) |
| OBV | Early accumulation on both frames · above MA20 (90d +15.2% / 2y +21.2%) · slope flat |
| Volume | 1,048,700 · 2.52× the 20-day average (416,590) |
| ATR stops | 1×ATR $27.67 · 2×ATR $26.84 |
① Price & Moving Averages
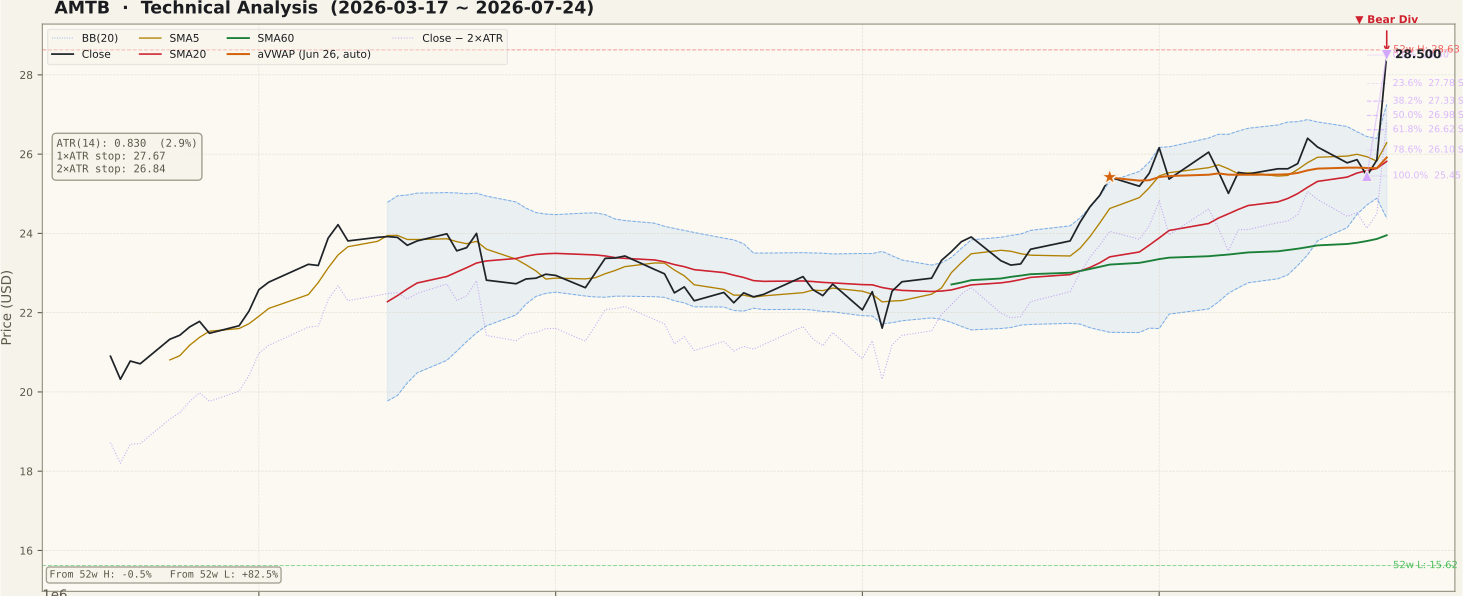
The two-year chart shows a wide, choppy base: repeated advances toward the $24–$26 area through 2024–2025, deep pullbacks into the $16–$18 zone, and then a steadier uptrend from early 2026. Friday's session broke that entire structure to the upside — a near-vertical bar from the mid-$25s to $28.50, closing within 0.5% of the 52-week high of $28.63. The moving averages are in a textbook bullish alignment (Close > SMA5 $26.29 > SMA20 $25.82 > SMA60 $23.95, all rising), and price is above both the 90-day aVWAP at $25.92 (anchored Jun 26) and the two-year aVWAP at $21.21 — buyers across both horizons sit in profit, which reduces overhead sell pressure. The stretch is equally clear: the close is above the upper Bollinger Band ($27.25) with band width already expanding at 11.12%. Fibonacci retracements of the latest up-swing ($25.45 on Jul 22 → $28.50 on Jul 24) frame the pullback supports: $27.78 (23.6%), $27.33 (38.2%), $26.98 (50%), $26.62 (61.8%) and $26.10 (78.6%), with 100% of the swing at $25.45.
② Volume

Friday printed 1,048,700 shares — 2.52× the 20-day average of 416,590 — so this is not a low-participation drift to new highs; the breakout is volume-confirmed, which is the single most important box a breakout must tick. The 90-day panel also shows volume spikes clustering through July rather than appearing as a one-off, consistent with the OBV accumulation reading below. One caution belongs here: a ~12% two-session surge on heavy volume in late July, the heart of earnings season for regional banks, strongly suggests a news catalyst that chart data alone cannot verify. Before acting on the technicals, check what actually drove the move. No unfilled gaps remain on either timeframe (the two-year scan counted five gaps, all filled), so there is no gap magnet above or below.
③ MACD

MACD sits at 0.69 above its signal line at 0.61, with the histogram positive at +0.08 and a fresh golden cross printed on Jul 24 — the same day as the breakout bar. Notably, this cross happened well above the zero line: momentum never fully reset after the June–July advance, and the brief mid-July dip in the histogram has flipped back to green. A cross above zero is a continuation signal rather than an early-cycle turn, which fits the picture of an established uptrend re-accelerating. The 90-day panel shows the June leg, a shallow momentum pause, and now a second push — constructive, but a one-day-old cross is young, and after a vertical price bar the histogram can whipsaw if price consolidates. Treat the cross as confirmation of trend health, not as a standalone entry trigger.
④ RSI

RSI(14) reads 73.7, above the 70 overbought line, and the chart engine flags a bearish divergence: on Jul 1 price was $26.16 with RSI at 74.86, while on Jul 24 price is far higher at $28.50 with RSI slightly lower at 73.67. Two honest observations follow. First, the divergence is real but mild — RSI gave up barely a point while price gained 9%, which is closer to "momentum not expanding" than to a classic exhaustion pattern. Second, a common beginner mistake is treating overbought RSI in a fresh breakout as an automatic sell: strong breakouts routinely hold RSI above 70 for extended stretches. The correct read is that divergence marks the possibility of a pause, not a confirmed top — it argues against chasing the vertical bar, and it only gains teeth if price breaks back below the first Fibonacci supports around $27.78–$27.33.
⑤ Mansfield Relative Strength

Mansfield RS versus the S&P 500 stands at +24.9% — firmly in outperformance territory with a rising slope. The trajectory matters as much as the level: a week ago RS was +14.3 and a month ago +11.2, so the weekly change is +10.6 points and the monthly change +13.7 points — outperformance that is accelerating, not merely persisting. The two-year panel adds context: AMTB spent most of 2024–2025 below the zero line (a chronic market laggard) and only crossed into positive territory in early 2026. That regime change, followed by this acceleration, is the profile Stan Weinstein's framework looks for in a Stage 2 advance. Deeply negative RS would have been a standing objection to any bullish setup; here the RS panel is the strongest single argument on the bull side of the ledger.
⑥ ATR & ADX

ATR(14) is $0.83, or 2.91% of price — moderate daily swing for a regional bank, though Friday's bar shows realized volatility expanding off its early-July lows. ADX reads 25.3 on the 90-day frame, just across the >25 threshold labeled a strong trend, while the two-year computation sits a touch lower at 24.8 ("emerging"): both agree the trend is strengthening but young, not mature. Remember ADX measures trend strength, not direction — here it is rising alongside an advancing price, which is the healthy combination. For risk management, the ATR-derived references are 1×ATR at $27.67 and 2×ATR at $26.84; the 2× level, about 5.8% below Friday's close, is the objective invalidation line for the breakout and conveniently sits just below the 50% retracement at $26.98. Position size should be set from that distance, not from hope.
⑦ OBV (On-Balance Volume)

OBV tells the same story on both frames — tagged early accumulation, with OBV above its 20-day average by +15.2% on the 90-day view and +21.2% on the two-year view. The two-year panel is the more persuasive one: OBV based out through 2025 and has climbed persistently since spring 2026, meaning accumulation preceded this breakout rather than merely reacting to it — the opposite of the "price at highs, OBV lagging" non-confirmation pattern. The one nuance is the flat slope tag on the most recent stretch: OBV plateaued briefly before Friday's volume spike lifted it to new highs. For confirmation that institutional demand is following through, OBV should keep printing new highs alongside price in the coming sessions; an OBV rollover below its MA20 while price hovers near $28 would be an early distribution warning.
Bull Case vs Bear Case
Bull Case
- Breakout to a new 52-week-high area on 2.52× average volume — volume-confirmed, not a quiet drift.
- Full bullish MA alignment (Close > SMA5 > SMA20 > SMA60, all rising) after a two-year base.
- Mansfield RS +24.9% vs the S&P 500, rising and accelerating (+10.6 pts week-over-week).
- Fresh MACD golden cross (Jul 24) above the zero line — continuation-style momentum signal.
- OBV in early accumulation on both frames, above its MA20 (90d +15.2%, 2y +21.2%) — demand preceded the breakout.
- Price above both aVWAPs ($25.92 / $21.21): holders across horizons are in profit, thinning overhead supply.
Bear Case
- RSI 73.7 overbought with a flagged bearish divergence (Jul 1 RSI 74.86 vs Jul 24 RSI 73.67 at a higher price).
- Close $28.50 sits above the upper Bollinger Band ($27.25) — statistically stretched after a vertical bar.
- ~12% two-session surge on heavy volume in earnings season — likely a news catalyst the chart cannot verify; chase risk is high.
- Immediate resistance overhead: the 52-week high $28.63 is only 0.5% away.
- ADX ~25 says the trend is only just reaching "strong" — young trends fail more often than mature ones.
- First meaningful support cluster ($27.33–$26.98) sits 4–5% below; a routine cooldown would still feel sharp.
Scenarios
| Scenario | Probability | Path | Trigger / Invalidation |
|---|---|---|---|
| Consolidate, then continue | ~45% | A shallow, low-volume pause holds the 23.6–38.2% retracements ($27.78–$27.33), digesting the surge sideways; a later push clears $28.63 and price discovery resumes above the 52-week high. | Trigger: pullback volume drops well below average while $27.33 holds on a closing basis. Invalidation: a close below $26.84 (2×ATR stop). |
| Deeper pullback into the base of the swing | ~35% | The RSI divergence and upper-band stretch resolve with a retrace toward the 50–61.8% zone ($26.98–$26.62), tagging the stop area before buyers defend; the larger uptrend stays intact and rebuilds. | Trigger: failure to hold $27.33 within the next few sessions. Invalidation of the pullback-buy idea: closes below $26.10 (78.6%) with rising volume. |
| Failed breakout (bull trap) | ~20% | The catalyst fades or disappoints on inspection; price closes back below $26.84 and then the $25.45 swing low, returning to the prior range near SMA20 ($25.82) and aVWAP ($25.92), trapping breakout buyers. | Trigger: a heavy-volume close below $26.84. Confirmation: loss of $25.45. This path would also flip the fresh MACD cross back to negative. |
Key Levels
| Price | Role | Basis |
|---|---|---|
| $28.63 | Resistance | 52-week high — 0.5% overhead |
| $28.50 | Current close | Fri, Jul 24 close · 0% of the swing |
| $27.78 | Support | 23.6% retracement of the Jul 22 → Jul 24 up-swing |
| $27.33 | Support | 38.2% retracement — first structural test of the breakout |
| $26.98 | Support | 50% retracement of the swing |
| $26.84 | Stop-loss | 2×ATR stop — objective invalidation, −5.8% from close |
| $25.45 | Support | 100% of the swing (Jul 22 low) · near SMA20 $25.82 / aVWAP $25.92 cluster |
What to Watch
- The catalyst itself — identify what drove the ~12% surge (late-July earnings window). The durability of this breakout depends on the news, not just the chart.
- Pullback volume — a constructive pause comes on shrinking volume; heavy-volume red bars below $27.78 would say distribution, not digestion.
- The $27.33–$26.98 retracement zone — whether the first real test of the breakout holds on a closing basis decides between the two bullish scenarios.
- RSI divergence resolution — RSI holding above ~55 on a pullback keeps the momentum structure intact; a fast drop through 50 gives the divergence teeth.
- OBV follow-through — new OBV highs with price confirm accumulation; an OBV break below its MA20 near the highs is an early warning.
Conclusion
Past Analyses of This Stock same ticker · newest first
This analysis is an educational interpretation of chart data and is not investment advice. Probabilities and levels are subjective estimates; every investment decision, and its outcome, is your own responsibility. Where a sharp price move may reflect a fundamental catalyst (earnings, corporate actions, sector news), technical signals alone are not a sufficient basis to buy or sell — verify the underlying news first.
Two Week Swing · twoweekswing.com · 4,600+ stocks screened weekly