AMC Global Media Inc.
$11.20 −3.9% from the 52-week high of $11.66
This analysis is based on closing-price data as of July 31, 2026. Whether you're researching how to buy AMC Global Media Inc. stock or you've just opened a brokerage account and are trying to time an entry, here are objective support levels and stop-loss references built from the RSI, MACD and ATR indicators.
AMCX closed the week at $11.20 on volume of 3,207,600 shares — 4.76× its 20-day average of 674,470. That single session did most of the work: the 90-day Fibonacci swing is anchored on a low of $9.71 (Jul 30) and a high of $11.20 (Jul 31), meaning the entire "swing" the retracement grid is built on is two sessions old. The two-year picture is genuinely improved — Mansfield RS has climbed from roughly −40 in 2024 to +24.97% versus the Nasdaq Composite, and price sits above the SMA5/SMA20/SMA60 stack — but ADX at 13.7 says there is no measured trend strength underneath the pop, and an ATR of 5.54% of price on a 20-day average of well under a million shares makes this a thin, fast-moving name. Read the sections below as a structural map, not a green light.
Snapshot as of the July 31, 2026 close · values taken from the chart data file
| Metric | Value | Read |
|---|---|---|
| Close | $11.20 | Highest close of the two-year window |
| 52-week high / low | $11.66 / $5.41 | −3.9% from the high, +107.0% off the low |
| SMA5 / SMA20 / SMA60 | $10.31 / $10.20 / $9.68 | Price above all three; stack in ascending order |
| Bollinger upper / mid / lower | $10.98 / $10.20 / $9.42 | Close is above the upper band; band width 15.32% |
| aVWAP (90d, anchored May 11, 2026) | $9.78 | Price well above the short-term anchor |
| aVWAP (2y, anchored Aug 8, 2025) | $8.48 | Long-term buyers are far in the money |
| RSI(14) | 63.10 (2y) / 63.13 (90d) | Below overbought; bearish divergence flagged |
| Mansfield RS vs Nasdaq Composite | +24.97% | Outperform, rising (prev week +11.73, prev month +15.11) |
| MACD / signal / histogram | 0.1457 / 0.1342 / +0.0115 | Golden cross dated Jul 31, 2026 — one session old |
| ADX(14) | 13.75 (2y) / 14.22 (90d) | Ranging — no established trend strength |
| ATR(14) | $0.62 (5.54% of price) | High relative volatility for position sizing |
| OBV | −24,987,400 (2y) / 2,561,100 (90d) | Early accumulation (2y, flat) · Accumulation (90d, rising, +207.62% vs MA20) |
| Volume / 20-day average | 3,207,600 / 674,470 = 4.76× | Single-session participation spike on a thin base |
| 1× / 2× ATR stop reference | $10.58 / $9.96 | Objective invalidation levels below the close |
① Price & Moving Averages
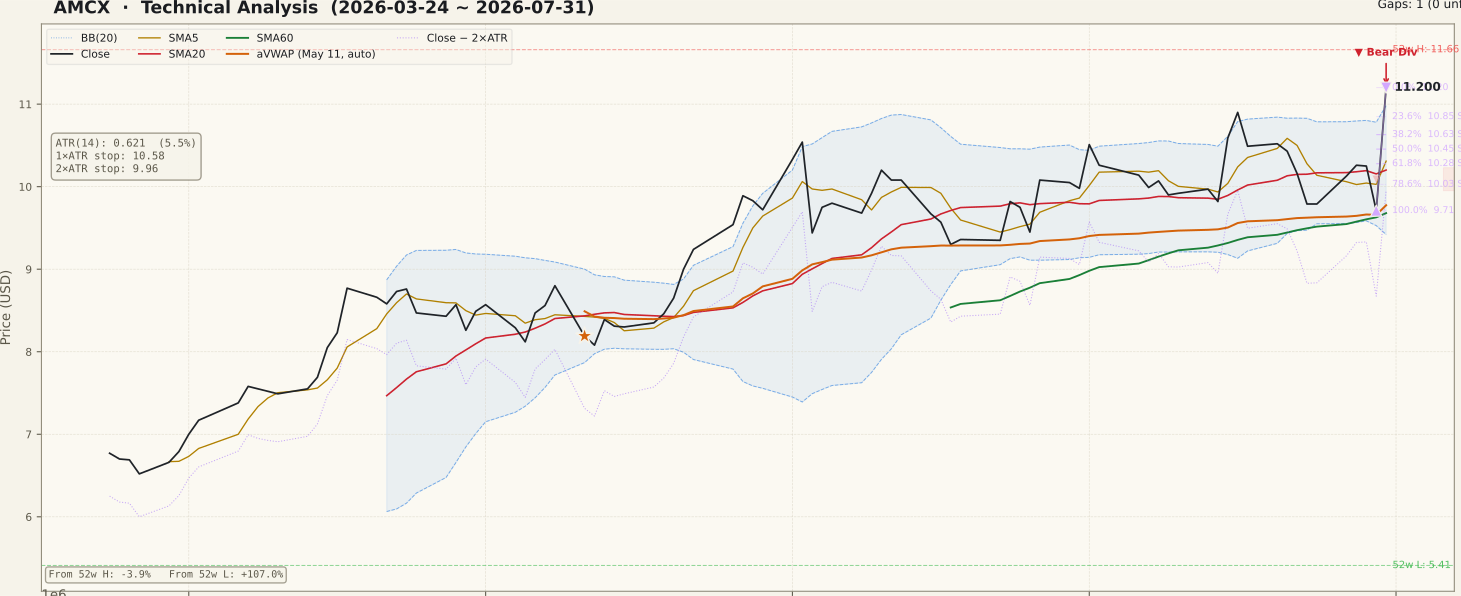
The moving-average stack is in ascending order — SMA5 $10.31 above SMA20 $10.20 above SMA60 $9.68 — and the $11.20 close sits above all three, which is the textbook configuration a breakout screen looks for. It also sits above the upper Bollinger Band at $10.98, so on a strict band reading the close is extended rather than merely strong. The 2-year Fibonacci grid, anchored on the May 12 low of $8.08 and the June 2 high of $10.54, has been fully cleared: what used to be the 0% swing high at $10.54 now sits below the market. The 90-day grid tells a different story — its anchors are $9.71 (Jul 30) and $11.20 (Jul 31), consecutive sessions, so its retracement lines at $10.85, $10.63 and $10.45 have almost no trading history behind them and should be treated as provisional. One unfilled gap remains far below, a support gap between $6.04 and $6.28 dated Aug 8, 2025 — it is not relevant to near-term positioning but it marks where the 2025 base began.
② Volume

This is the panel that dominates the whole page. Last-session volume was 3,207,600 shares against a 20-day average of 674,470 — a ratio of 4.76×, and the largest bar anywhere in the 90-day window. Volume that heavy confirms the price move in the narrow technical sense: this was not a low-participation drift higher, and the usual beginner trap of an unconfirmed breakout does not apply here. The harder question is what it confirms. A 4.76× session on a base of roughly 674,000 shares is a one-day event, not a new liquidity regime, and the base itself is thin for an $11 stock — bid-ask spread and slippage on entry and exit are real costs at this size, and a single institutional print or a retail crowd can move the tape. Treat the spike as evidence that something happened, and the 20-day average as the level volume has to hold above for that something to be durable.
③ MACD

MACD is at 0.1457 with the signal line at 0.1342, a histogram of +0.0115, and a golden cross dated Jul 31, 2026 — the same session as the volume spike. Both lines are above zero, so the cross is a re-acceleration inside positive territory rather than an early bottom signal. The caution is that the cross is exactly one session old and the histogram is barely positive: the 90-day panel shows several crosses in June and July that reversed within days, which is the normal behaviour of a momentum oscillator in a range. A golden cross on the same bar that produced a 4.76× volume spike is largely a mechanical consequence of that bar, not independent confirmation of it.
④ RSI

RSI(14) reads 63.10 on the 2-year series and 63.13 on the 90-day — comfortably below the 70 overbought line, which is unusual for a stock that just posted its highest close of the window. That gap is exactly what the flagged bearish divergence describes: the first peak on Jun 26, 2026 paired a price of $10.08 with RSI 63.8, while the second peak on Jul 31, 2026 paired a higher price of $11.20 with a slightly lower RSI of 63.13. Higher price, lower momentum. Two qualifications matter before anyone treats this as a top. First, the RSI difference is fractions of a point — this is a marginal divergence, not the wide, multi-week variety. Second, a divergence is a possibility of reversal, never a confirmation; it needs price to actually fail a level before it means anything, and until then the stock is simply not overbought.
⑤ Mansfield Relative Strength

Mansfield RS is +24.97% versus the Nasdaq Composite, in the outperform zone with a rising slope, and this is the single most constructive number on the page. A week ago the reading was +11.73 and a month ago +15.11, so the change is +13.24 points on the week and +9.86 on the month — positive territory getting more positive, which is the accelerating quadrant. The 2-year panel gives that number its weight: RS spent all of 2024 and most of 2025 between −30 and −45, crossed zero around December 2025, and has held above the line since roughly May 2026. This is a genuine multi-quarter change in how the stock trades against its index, not a one-week artefact — though the last week's jump is itself a product of the same single session as everything else here.
⑥ ATR & ADX

ATR(14) is $0.62, or 5.54% of the $11.20 close — high enough that a normal day's range can carry price through two or three of the 90-day Fibonacci lines without any of them meaning anything. That volatility is the reason the stop references are set where they are: $10.58 at 1× ATR and $9.96 at 2× ATR, the latter roughly 11.1% below the close. Anyone sizing a position here should size it off that 11.1%, not off a tighter number borrowed from a calmer stock. ADX is 13.75 on the 2-year series and 14.22 on the 90-day — both firmly in ranging territory, well under the 20 threshold where a trend is considered to be forming. Note what ADX does and does not say: it measures strength, not direction, and a reading in the 13–14 zone alongside a fresh high says the move has not yet built the kind of directional persistence that carries a swing.
⑦ On-Balance Volume

The two timeframes disagree in degree, and both are worth stating. On the 90-day series OBV is 2,561,100 against a 20-day average of 832,565 — above its average, rising, tagged accumulation, with a divergence of +207.62% that is itself an artefact of the last session's enormous volume being added to a small running total. On the 2-year series OBV is −24,987,400 against an average of −26,715,935: above its average and tagged early accumulation, but with a flat slope and a deeply negative absolute level, the legacy of the 2024–25 distribution visible in the long panel. The honest summary is that short-term buying pressure is real and recent, while the long-term OBV base is still repairing damage rather than confirming a new advance.
Bull Case vs Bear Case
Bull Case
- Mansfield RS +24.97% versus the Nasdaq Composite and rising, up from +11.73 a week ago and +15.11 a month ago — positive and accelerating.
- Full ascending moving-average stack: close $11.20 above SMA5 $10.31, SMA20 $10.20 and SMA60 $9.68.
- Volume of 3,207,600 at 4.76× the 20-day average means the move was participated in, not drifted into.
- MACD golden cross dated Jul 31, 2026 with both lines above zero and a positive histogram of +0.0115.
- 90-day OBV in accumulation — 2,561,100 above its 832,565 average and rising; the 2-year series is above its own average as well.
- The June 2 swing high of $10.54, the 0% anchor of the 2-year Fibonacci grid, now sits below the market rather than above it.
Bear Case
- Bearish RSI divergence: $10.08 at RSI 63.8 on Jun 26 versus $11.20 at RSI 63.13 on Jul 31 — higher price, lower momentum.
- ADX 13.75 (2y) and 14.22 (90d) are ranging readings; there is no measured trend strength beneath the new high.
- ATR is 5.54% of price, so the objective 2× ATR invalidation at $9.96 sits about 11.1% away — an expensive stop to carry.
- Liquidity is thin: a 20-day average of 674,470 shares on an $11 stock. The 4.76× session is an anomaly, not a new baseline, and spread and slippage are material.
- The 90-day Fibonacci swing spans consecutive sessions — $9.71 on Jul 30 to $11.20 on Jul 31 — so every level derived from it is two days old.
- The close is 3.9% below the $11.66 52-week high, a distance smaller than one ATR, and it sits above the upper Bollinger Band at $10.98 — extended in both readings.
Scenarios
| Scenario | Probability | Path | Trigger / Invalidation |
|---|---|---|---|
| Follow-through | 35% | Price holds the $10.85 shelf, volume stays above the 674,470 baseline, and the $11.66 52-week high gives way. | Trigger: daily close above $11.66 on above-average volume. Invalidation: close back under $10.45. |
| Retrace into the stack | 45% | The spike bar gives back ground as the volume surge fades, with price working back toward SMA5/SMA20 at $10.31–$10.20 and the Bollinger mid. | Trigger: failure to hold $10.85 within a few sessions. Invalidation: reclaiming and holding $11.20 on volume. |
| Full round trip | 20% | The move unwinds entirely, back through the SMA60 at $9.68 and the 90-day aVWAP at $9.78 toward the 2-year 38.2% level at $9.60. | Trigger: close below the 2× ATR reference at $9.96. Invalidation: defending $10.20 on the first test. |
Key Levels nearest to price first, descending
| Level | Role | Basis |
|---|---|---|
| $11.66 | Resistance | 52-week high |
| $11.20 | Current close | Jul 31, 2026 close; 0% anchor of the 90-day Fibonacci swing |
| $10.98 | Pivot | Upper Bollinger Band — price is currently above it |
| $10.85 | Support | 90-day Fibonacci 23.6% retracement |
| $10.58 | Support | 1× ATR stop reference |
| $10.20 | Support | SMA20 and Bollinger mid-band |
| $9.96 | 2× ATR stop | Objective invalidation, about 11.1% below the close; coincides with the 2-year Fibonacci 23.6% level |
What to Watch
- Volume decay. Whether daily turnover holds above the 674,470-share 20-day average in the sessions after the spike, or collapses straight back under it — the fastest tell for whether the move had follow-on interest.
- The $10.85 shelf. The 90-day 23.6% retracement is the first level a pullback meets. Holding it keeps the two-session swing intact; slicing through it says the grid was never real support.
- Divergence resolution. RSI pushing decisively above the Jun 26 reading of 63.8 while price holds its higher high would cancel the bearish divergence; a lower high in price with RSI fading confirms it.
- ADX direction. A turn up from 13.75 through 20 and toward 25 would be the first evidence that a trend, rather than a spike, is forming.
- Relative strength persistence. Whether Mansfield RS holds near +24.97% or slides back toward last week's +11.73 once the index-relative effect of the single session washes out.
Conclusion
Past Analyses of This Stock same ticker · newest first
This analysis is an educational interpretation of chart data and is not investment advice. Probabilities and levels are subjective estimates; every investment decision, and its outcome, is your own responsibility. Stocks trading on a light average volume base can move sharply on small orders — spread, slippage and execution risk are material at this size. Where a price move appears to be driven by a fundamental catalyst that the chart cannot identify, technical signals alone are not a basis for buying.
Two Week Swing · twoweekswing.com · 4,600+ stocks screened weekly