Alumis Inc.
This analysis is based on closing-price data as of July 10, 2026. Whether you're researching how to buy Alumis stock or you've just opened a brokerage account and are trying to time an entry, here are objective support levels and stop-loss references built from the RSI, MACD and ATR indicators.
Alumis is one of the most dramatic re-rating stories on the Nasdaq over the past year: the clinical-stage biotech gapped violently higher in early January 2026 and now trades +772.4% above its 52-week low of $3.24, within 9.7% of the $31.35 high. The current setup is a moving-average trend: price sits above a rising SMA20 and SMA60, MACD has been on a golden cross since June 11, and Mansfield RS at +67.2% versus the Nasdaq Composite is still accelerating. The main caveats are thin recent volume (0.47x average), an RSI in the low 60s after a fast V-shaped recovery from $18.99 to $30.30, and the binary event risk that comes with any clinical-stage name.
Snapshot all values from the July 10, 2026 chart data
| Close | $28.31 | 52-week high / low | $31.35 (-9.7%) / $3.24 (+772.4%) |
|---|---|---|---|
| SMA5 / SMA20 / SMA60 | $28.98 / $25.78 / $23.93 | Bollinger (20) | $20.55 – $31.00, mid $25.78, width 40.54% |
| aVWAP (2y) | $22.61 (anchor Jan 6, 2026) | aVWAP (90d) | $24.01 (anchor Mar 30, 2026) |
| RSI (14) | 61.8 — firm but not overbought | Mansfield RS (vs Nasdaq Composite) | +67.17% — outperform, rising slope |
| MACD (12,26,9) | 1.79 vs signal 1.40, histogram +0.39 — golden cross Jun 11, 2026 | ADX (14) | 35.1 — strong trend |
| ATR (14) | $1.77 (6.25% of price) | Volume vs 20-day avg | 0.47x (888,084 vs 1,893,944) |
| OBV (2y) | Accumulation — above rising 20-day MA, +8.04% | OBV (90d) | Accumulation — above rising 20-day MA, +247.04% |
| 1×ATR stop | $26.54 | 2×ATR stop | $24.77 |
① Price & Moving Averages
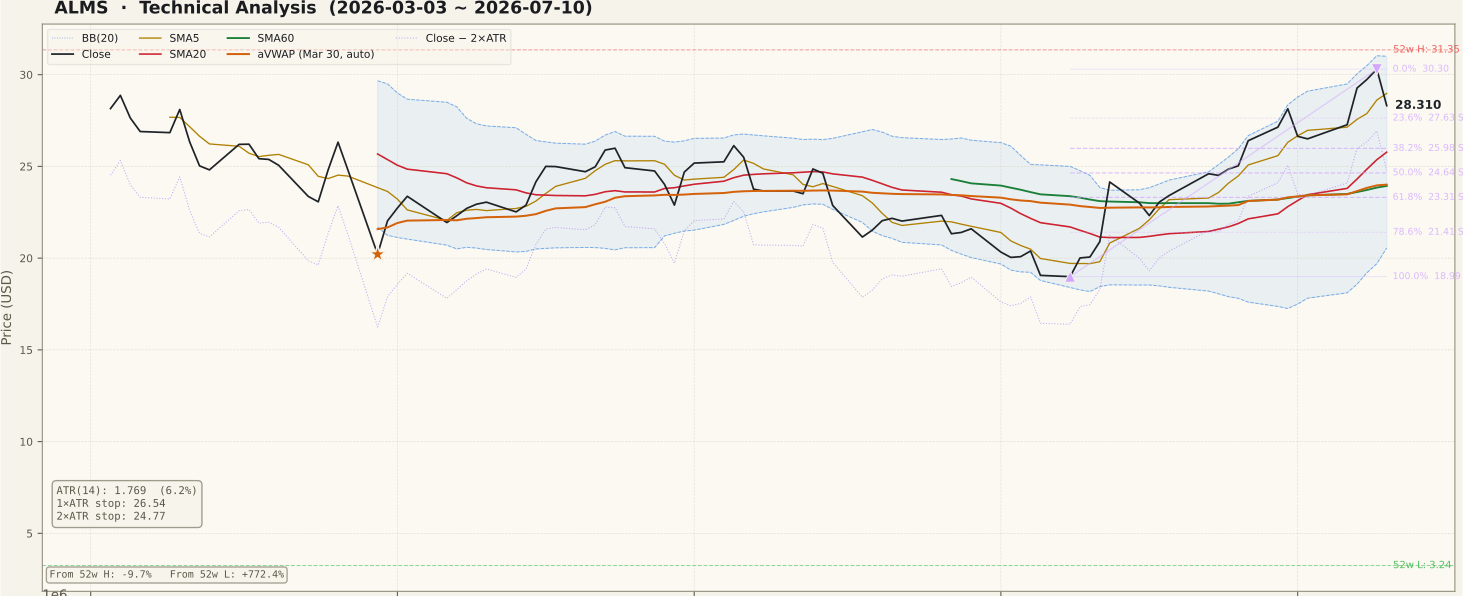
The two-year chart tells the backstory: a long decline through 2024–2025 to the $3–$5 area, a base, and then an explosive early-January 2026 gap that repriced the stock into the high teens in days — that event left a large unfilled support gap between $8.97 and $15.27. The 90-day window shows the more tradeable structure: a June 8 swing low at $18.99 followed by a V-shaped recovery to $30.30 on July 9, reclaiming every moving average on the way. The close at $28.31 sits above the rising SMA20 ($25.78) and SMA60 ($23.93), above both anchored VWAPs, and just under the SMA5 at $28.98 after a one-day pause. Against the June-July swing, the first retracement supports sit at $27.63 (23.6%) and $25.98 (38.2%). The Bollinger Bands remain wide (40.5%), so this is a trending tape, not a squeeze — but a wide-band trend can also correct sharply when it pauses.
② Volume

This is the weakest link in an otherwise strong chart. The latest session traded only 888,084 shares, 0.47x the 20-day average of 1,893,944 — and while the late-June/early-July advance did include green above-average days, the push to $30.30 was not accompanied by the kind of volume expansion that usually confirms a breakout attempt. A rally on fading volume is not automatically doomed, but it is easier to reverse, and textbook practice is to treat any move through resistance on below-average volume with suspicion until buyers prove themselves. With a ~$25 million average daily dollar volume the name is tradeable, but the 6.25% daily ATR means slippage on fast days is a real cost. Watch for a volume spike in either direction: above-average green volume through $30.30 would validate the trend; heavy red volume under $27.63 would flag distribution.
③ MACD

MACD has been on a golden cross since June 11, 2026 — a cross that formed well below the zero line, which is often the earliest and most powerful variety — and both lines have since climbed firmly into positive territory, with MACD at 1.79 above the signal at 1.40 and a green histogram of +0.39. The histogram has stayed positive for roughly a month, confirming that upside momentum has persisted rather than flamed out after the initial thrust. The caution here is altitude: after a near-60% run off the June low, MACD is stretched relative to its 90-day range, and the histogram has flattened over the last few sessions. That is consistent with a pause or shallow pullback; an outright dead cross from this height would be the momentum signal that the June advance has fully run its course.
④ RSI

RSI(14) reads 61.8 — firm, but back below the overbought line after briefly tagging the low 70s during the July push. On the 90-day chart RSI bottomed near 30 at the June low and has since carved a sequence of higher lows, mirroring price. A reading in the low 60s after a strong advance is what trend-followers want to see on a pause: momentum cooling without breaking. The two-year view adds a caution, though — the last two times RSI spent time above 70 (December 2025 and February 2026), multi-week corrections followed. No divergence is flagged in the data at the July 9 high. The practical read: RSI holding the 50–55 area on this pause keeps the swing structure intact; a fast drop through 50 would suggest the V-recovery is giving way.
⑤ Mansfield Relative Strength

Mansfield RS versus the Nasdaq Composite stands at +67.17% with a rising slope — ALMS is not just beating the index, it is beating it by a widening margin. A week ago the reading was 63.98 (weekly change +3.2 points) and a month ago 37.87 (monthly change +29.3 points): in the positive zone with positive change on both horizons, this is accelerating outperformance — the strongest quadrant. The RS line has been above zero continuously since the January repricing, so the market has treated ALMS as a leader for six months. Note that after the January spike RS spent March through May drifting down from extreme readings near 200 — the current re-acceleration from a higher base is a healthier, more sustainable pattern than that initial spike. Relative strength is this chart's single most persuasive bull argument.
⑥ ATR & ADX volatility & trend strength

ADX(14) at 35.1 confirms a strong trend, and it has been turning up through late June and July as the recovery gathered pace — rising ADX plus rising price is the combination trend-followers look for. ATR(14) is $1.77, a hefty 6.25% of the closing price, and it has been expanding again since mid-June. In plain terms, a routine day moves this stock more than many large caps move in a month, and position sizing must respect that: the 1×ATR reference sits at $26.54 and the 2×ATR stop at $24.77, about 12.5% below the close. A stop inside one ATR of entry in a 6%-ATR biotech is effectively a coin-flip against daily noise.
⑦ OBV on-balance volume

OBV is in accumulation on both windows — above a rising 20-day average by +8.04% on the two-year chart and by a striking +247.04% on the 90-day chart (the large percentage reflects a 20-day OBV average near its zero crossing; read it as OBV far above a just-turned-positive baseline rather than as a literal 247% flow gap). The shape matters more than the number: 90-day OBV was negative and falling into early June, based, then broke sharply higher in late June and made new highs alongside price into July — cumulative flow confirmed the V-recovery rather than lagging it. That partially offsets the thin latest-session volume: the money that did trade during the advance leaned to the buy side. If OBV rolls under its 20-day average while price holds up, that quiet divergence would be an early distribution warning.
Bull Case vs Bear Case
Bull Case
- Mansfield RS +67.2% vs the Nasdaq Composite — accelerating on both the weekly (+3.2) and monthly (+29.3) horizons.
- MACD golden cross since June 11 with a positive histogram sustained for a month.
- ADX 35 and rising — a strong trend, not a one-day squeeze.
- Price above the rising SMA20 ($25.78) and SMA60 ($23.93), and above both anchored VWAPs — average buyers are in profit.
- OBV in accumulation on both windows; 90-day OBV made new highs with price.
- Large unfilled support gap at $8.97–$15.27 far below — the January repricing has never been challenged.
Bear Case
- Latest volume just 0.47x average — the push toward $30 lacked convincing volume confirmation.
- Overhead supply close by: fib 0% at $30.30, Bollinger upper band $31.00, 52-week high $31.35.
- Close slipped back under the SMA5 ($28.98) after tagging $30.30 — short-term hesitation at resistance.
- ATR 6.25% of price — corrections in this name run fast and deep (June: -37% peak-to-trough in five weeks).
- RSI spent July flirting with 70; the last two overbought episodes preceded multi-week corrections.
- Clinical-stage biotech: the January gap shows how binary news can reprice the stock in a single session — in either direction.
Scenarios
| Scenario | Probability | Path | Trigger / Invalidation |
|---|---|---|---|
| Trend continuation to new highs | ~40% | Shallow pause holds the $27.63 (23.6%) retracement, then a volume-backed push through $30.30 opens the 52-week high at $31.35 and price discovery above it. | Trigger: daily close above $30.30 on above-average volume. Invalidation: close back below $27.63. |
| Consolidation above the 20-day | ~40% | Several weeks of sideways work between roughly $25.78 (SMA20 / 38.2% zone) and $30.30 while volume rebuilds and the MACD histogram resets. | Trigger: repeated rejections under $30.30 with support holding at $25.78–$25.98. |
| Failed breakout, deeper retracement | ~20% | Loss of the SMA20 at $25.78 puts the 2×ATR stop at $24.77 and the 50% retracement at $24.64 in play; below that, $23.31 (61.8%) and the SMA60 at $23.93 are the last trend supports. | Trigger: daily close below $25.78 on above-average volume. The swing setup is invalidated below $24.77. |
Probabilities are subjective estimates based on the chart evidence above, not forecasts.
Key Levels
| Price | Role | Basis |
|---|---|---|
| $31.35 | Resistance | 52-week high (Bollinger upper band $31.00 just below) |
| $30.30 | Resistance | July 9 swing high — 0% of the June-July swing |
| $28.98 | Resistance / pivot | SMA5 — immediate overhead line |
| $28.31 | Current close | July 10, 2026 |
| $27.63 | Support | 23.6% retracement of the June-July swing |
| $25.78 | Support | SMA20 / Bollinger midline; 38.2% retracement at $25.98 in the same zone |
| $24.77 | Stop-loss reference | 2×ATR stop — objective invalidation (-12.5% from close); 50% retracement $24.64 adjacent |
What to Watch
- Volume on any approach to $30.30 — a breakout attempt on another sub-average volume day is the classic trap to avoid chasing.
- The $27.63 retracement: holding it keeps the pause shallow; losing it shifts attention to the SMA20 at $25.78.
- The MACD histogram — still green but flattening; a shrink toward zero warns the June momentum wave is ending.
- Weekly Mansfield RS change — acceleration (+3.2 this week) is the bull thesis; a flip to negative weekly change would be the first crack.
- Any clinical or corporate headline — in a name that gapped +100%+ on news in January, no technical level survives a binary catalyst.
Conclusion
Past Analyses of This Stock same ticker · newest first
This analysis is an educational interpretation of chart data and is not investment advice. Probabilities and levels are subjective estimates; every investment decision, and its outcome, is your own responsibility. Alumis is a clinical-stage biotech — trial results and regulatory news can reprice the stock in a single session, far beyond any technical level. If a stock has just made an outsized news-driven move, technical signals alone are not a sufficient basis to act — check the fundamental catalyst first.
Two Week Swing · twoweekswing.com · 4,600+ stocks screened weekly